Fig. 10
Download original image
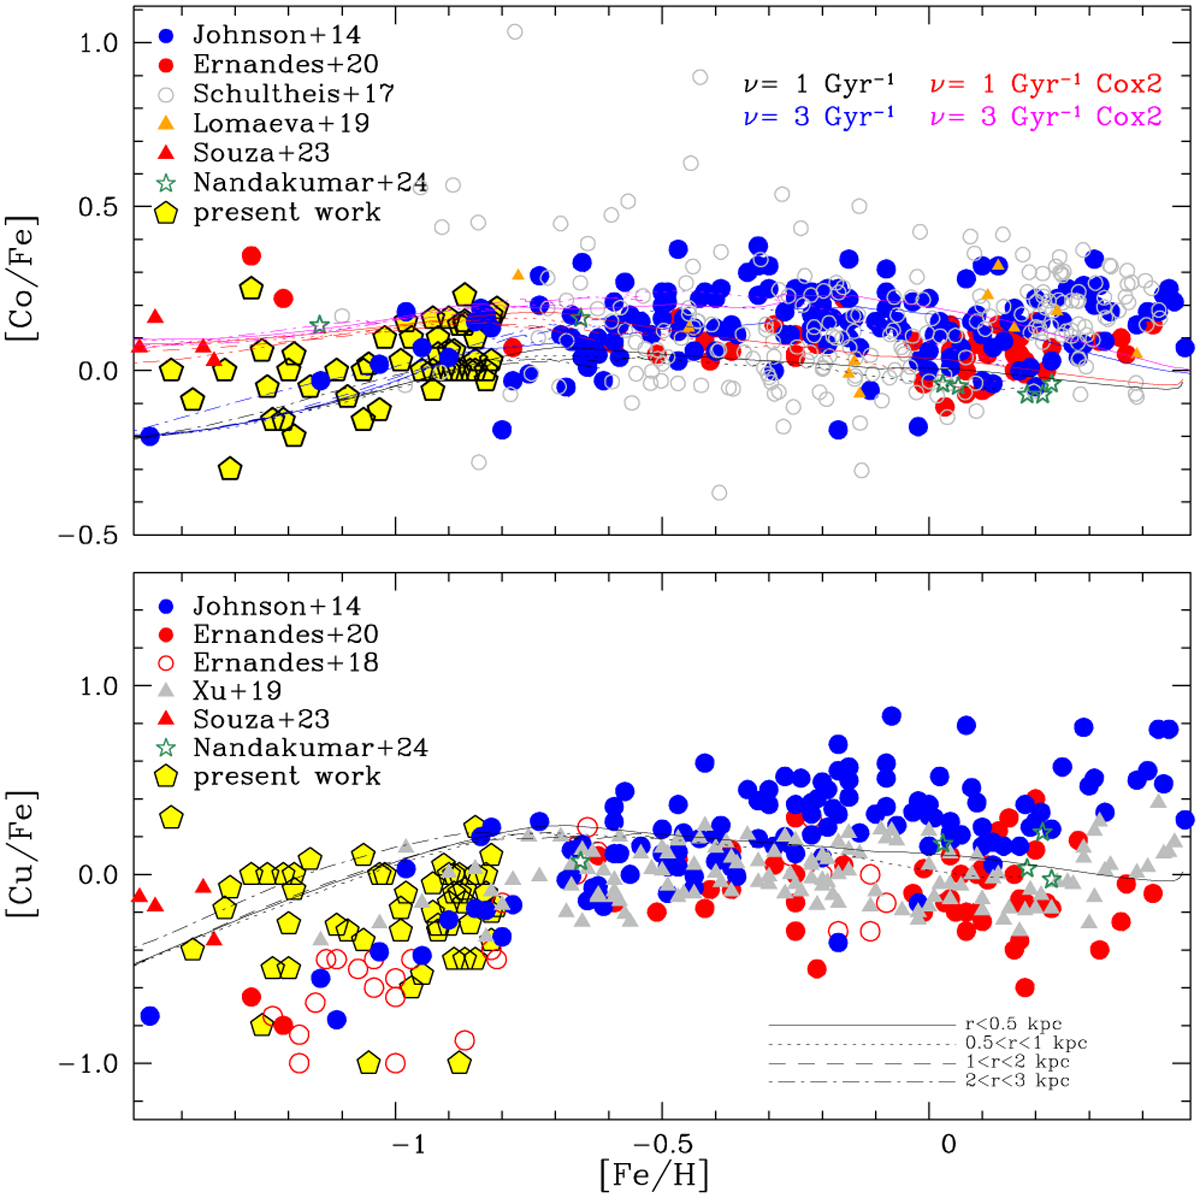
[Co/Fe] vs. [Fe/H] (upper panel) and [Cu/Fe] vs. [Fe/H] (lower panel): Chemical-evolution models with specific star formation of ν = 1 and 3 Gyr−1 for original yields from Woosley & Weaver (1995) (black and blue respectively), and for Co yields multiplied by two (red and magenta lines). Data consist of the present results (yellow pentagons) and literature data, including field data from Johnson et al. (2014) (blue filled circles), Ernandes et al. (2020) (red filled circles), and Schultheis et al. (2017) (open grey circles), and Xu et al. (2019) (filled grey triangles), plus GC data from Ernandes et al. (2018) (red open circles) in the lower panel. Different model lines are for the same radii from the Galactic centre, as in Fig. 8.
Current usage metrics show cumulative count of Article Views (full-text article views including HTML views, PDF and ePub downloads, according to the available data) and Abstracts Views on Vision4Press platform.
Data correspond to usage on the plateform after 2015. The current usage metrics is available 48-96 hours after online publication and is updated daily on week days.
Initial download of the metrics may take a while.