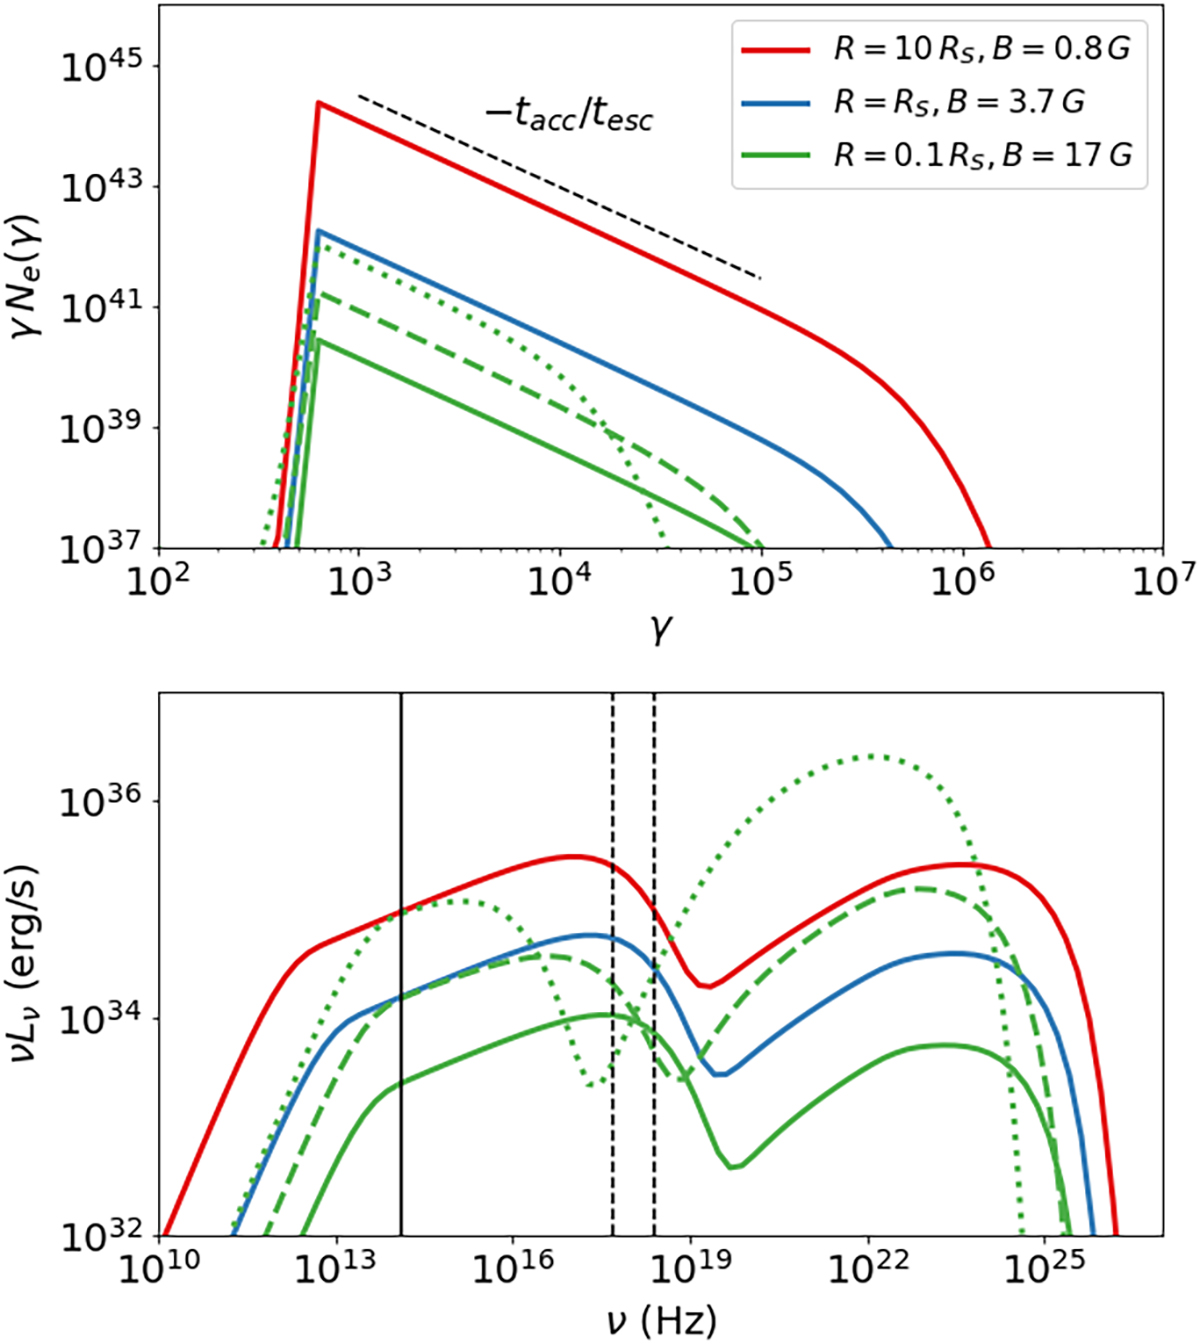
Fig. A.1.
Download original image
Effects of the flaring region size on particle and photon spectra of a nonthermal flare. Top panel: Electron distribution Ne(γ) multiplied by γ at t = 10 tacc for different radii and magnetic field strengths of the flaring region (see inset legend) and the same electron compactness ℓe (see Table 1). For R = 0.1 RS we also show results for 5ℓe (dashed line) and 25ℓe. Bottom panel: SSC spectra produced by the electron distributions shown on the left panel.
Current usage metrics show cumulative count of Article Views (full-text article views including HTML views, PDF and ePub downloads, according to the available data) and Abstracts Views on Vision4Press platform.
Data correspond to usage on the plateform after 2015. The current usage metrics is available 48-96 hours after online publication and is updated daily on week days.
Initial download of the metrics may take a while.