Fig. 7.
Download original image
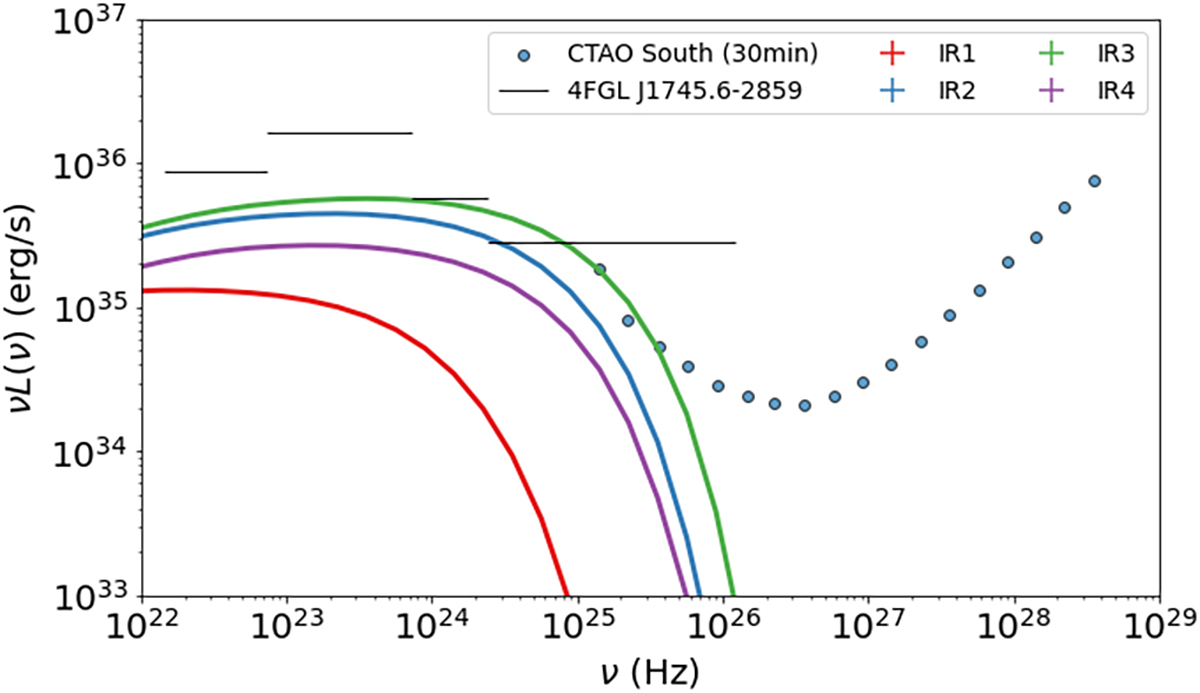
Zoom in the γ-ray range of the model spectra computed for epochs IR1–IR4. The differential sensitivity curve of CTAO South for an observing time of 30 min is overplotted. The black lines indicate the 10.5 yr integrated Fermi-LAT spectrum for the γ-ray source 4FGL J1745.6-2859, which is associated with the Galactic center (Cafardo et al. 2021).
Current usage metrics show cumulative count of Article Views (full-text article views including HTML views, PDF and ePub downloads, according to the available data) and Abstracts Views on Vision4Press platform.
Data correspond to usage on the plateform after 2015. The current usage metrics is available 48-96 hours after online publication and is updated daily on week days.
Initial download of the metrics may take a while.