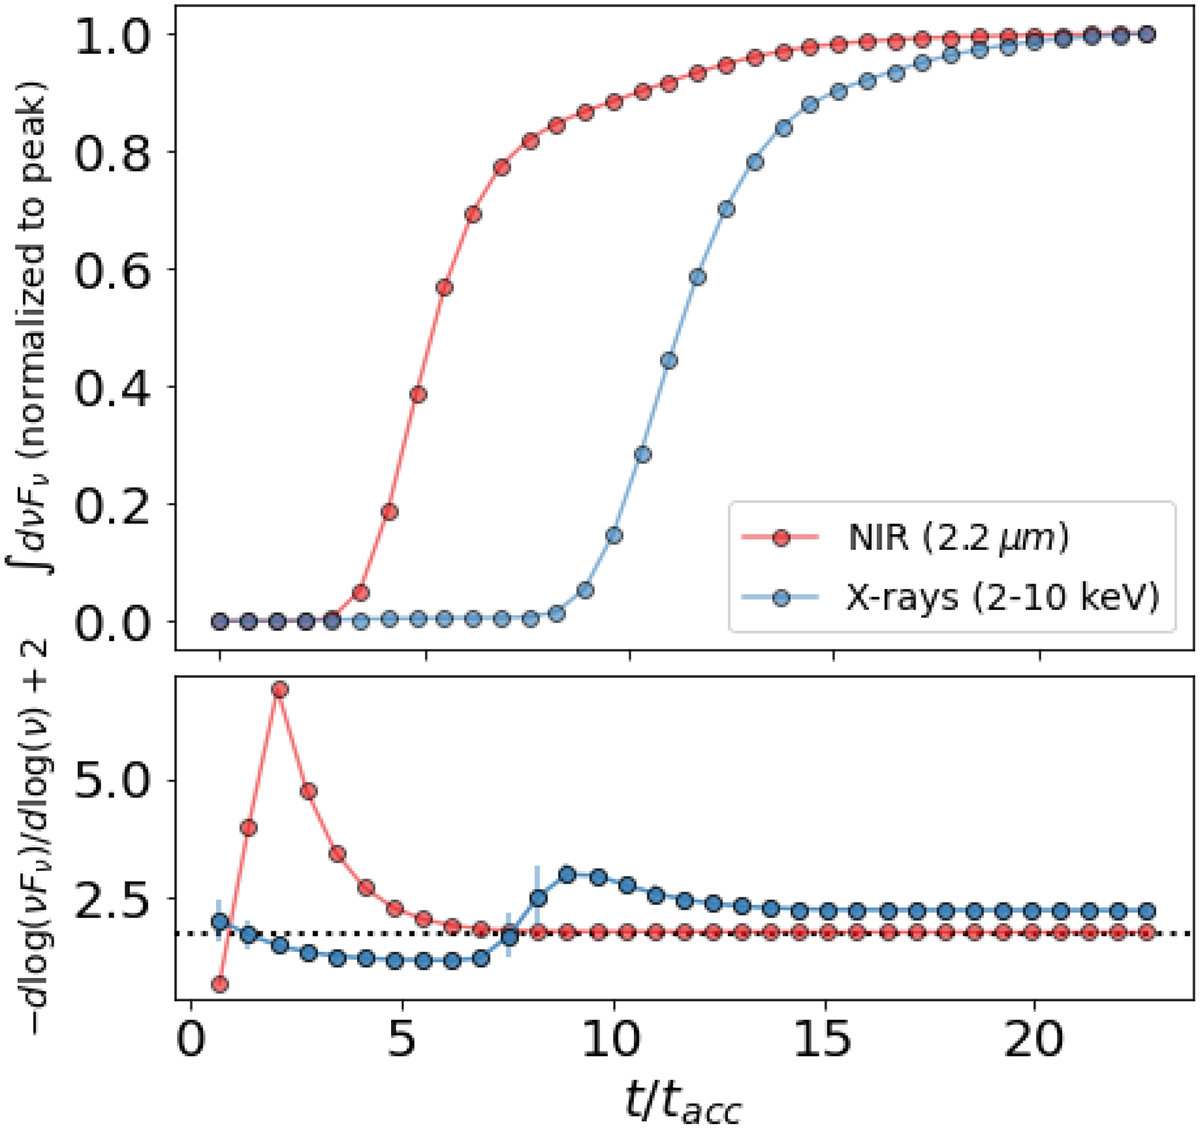
Fig. 2.
Download original image
Flux and photon index plotted as a function of time for the rising part of an NIR and X-ray flare. Top panel: NIR and X-ray light curves (normalized to their peak values) of the SSC model presented in Fig. 1. Bottom panel: Temporal evolution of the photon index at NIR and X-ray frequencies. For the latter case, the average value of the photon index in the 2–10 keV band is plotted. The error bar shows the standard deviation of the values in the 2–10 keV range. The horizontal dotted line marks the theoretical value of the photon index. In both panels, the markers are used to show the cadence of the numerical calculation (1 tcr).
Current usage metrics show cumulative count of Article Views (full-text article views including HTML views, PDF and ePub downloads, according to the available data) and Abstracts Views on Vision4Press platform.
Data correspond to usage on the plateform after 2015. The current usage metrics is available 48-96 hours after online publication and is updated daily on week days.
Initial download of the metrics may take a while.