Fig. 6
Download original image
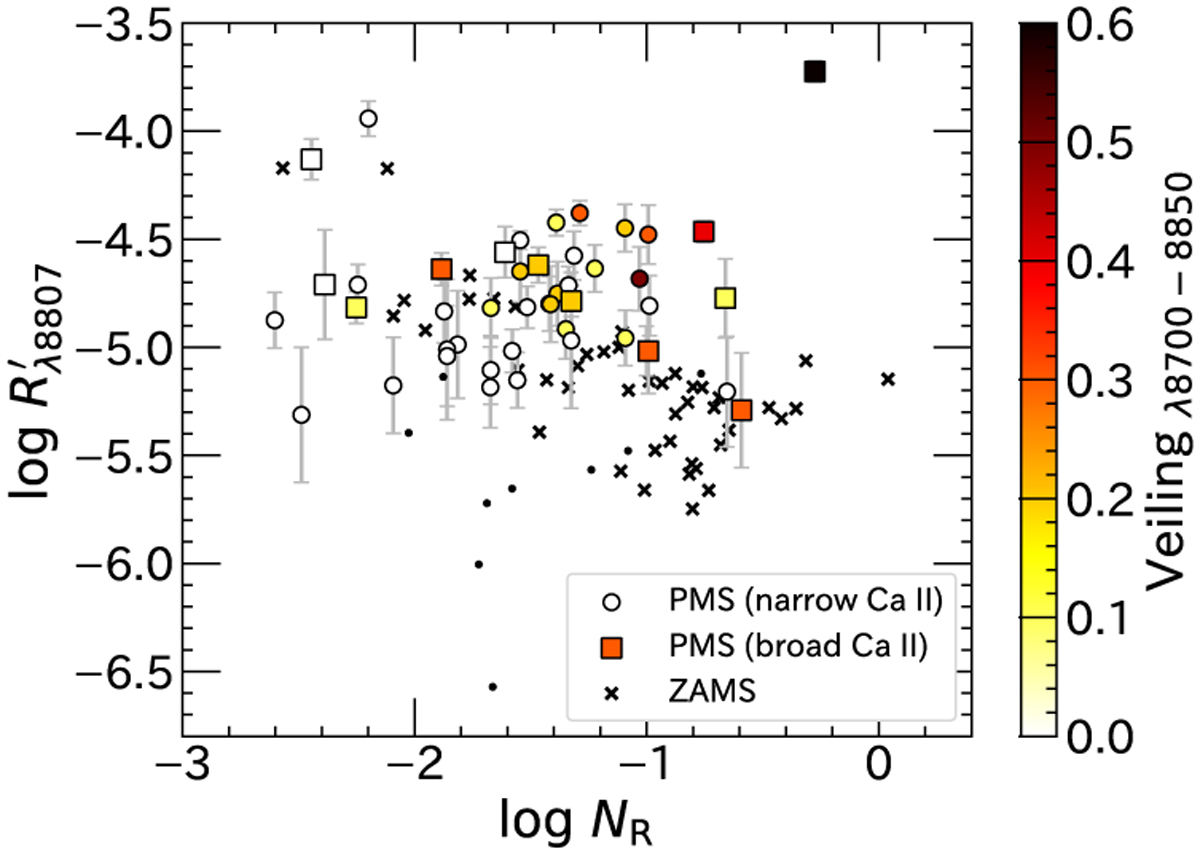
Relationship between the ratio of the surface flux of the chromospheric Mg I emission line to the stellar bolometric luminosity, R′, and the Rossby number, NR. Large circles represent PMS stars with narrow Ca II emission lines (<100 km s−1), while squares represent PMS stars with broad Ca II emission lines (>100 km s−1). The color of the large circles and squares indicates the amount of veiling measured in 8700– 8850 Å. Dots represent PMS stars with no significant detection of the Mg I emission line. ZAMS stars examined in Yamashita & Itoh (2022) are shown as cross symbols.
Current usage metrics show cumulative count of Article Views (full-text article views including HTML views, PDF and ePub downloads, according to the available data) and Abstracts Views on Vision4Press platform.
Data correspond to usage on the plateform after 2015. The current usage metrics is available 48-96 hours after online publication and is updated daily on week days.
Initial download of the metrics may take a while.