Fig. 3
Download original image
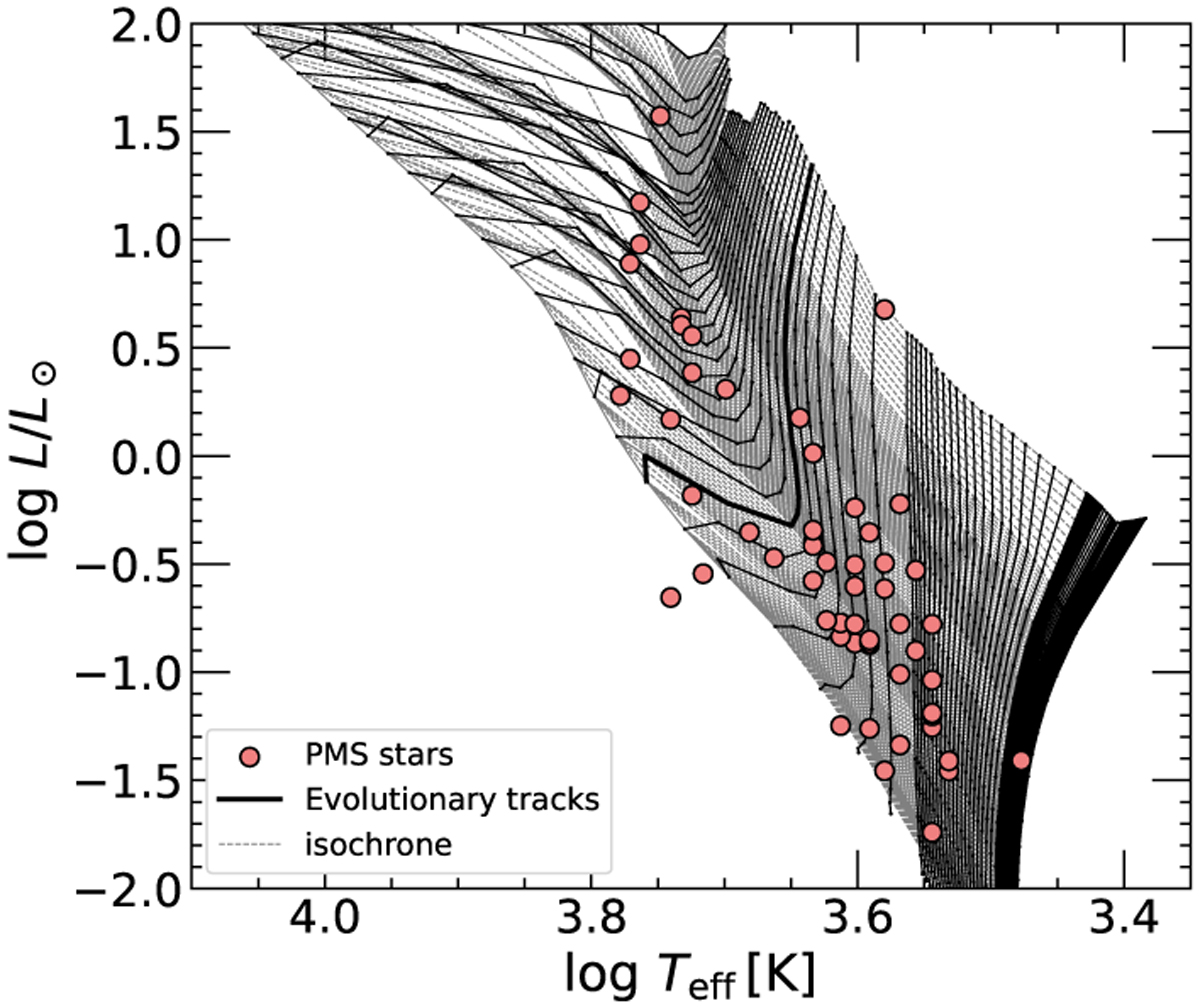
HR diagram of the investigated PMS stars. The solid and dashed lines denote the evolutionary tracks (0.065–4.5 M⊙) and isochrones (2 × 10⁵ yr to the main sequence) of Jung & Kim (2007). We linearly interpolated that model to one tenth of the original. The thick solid line denotes the evolutionary track for a 1 M⊙ star. The circles represent the PMS stars.
Current usage metrics show cumulative count of Article Views (full-text article views including HTML views, PDF and ePub downloads, according to the available data) and Abstracts Views on Vision4Press platform.
Data correspond to usage on the plateform after 2015. The current usage metrics is available 48-96 hours after online publication and is updated daily on week days.
Initial download of the metrics may take a while.