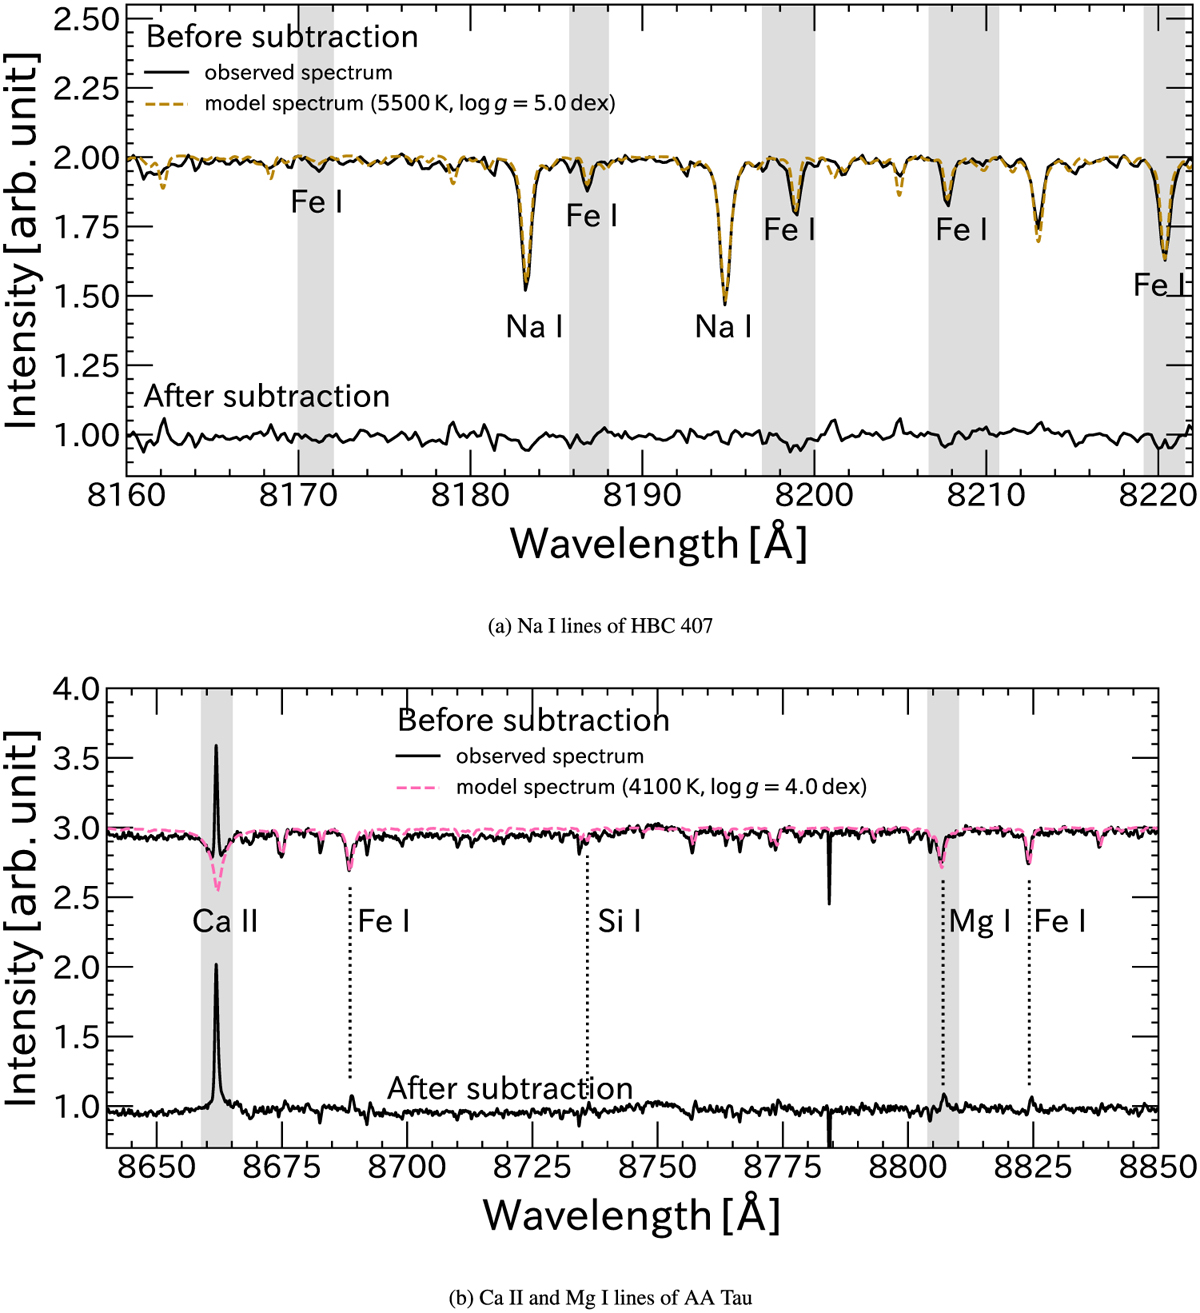
Fig. 1
Download original image
Procedure for subtracting the photospheric component from PMS star spectra. The top portion of each panel shows the observed spectrum (solid line), while the model spectrum is represented by the dashed line. For display purposes, the spectra of the PMS stars and the models are shifted by +1.0 or +2.0. The bottom portion of each panel displays the difference between the PMS star spectrum and the model spectrum. Hatched areas indicate Fe I, Ca II, and Mg I lines. Wavelengths within these hatched areas have been excluded from the fitting range.
Current usage metrics show cumulative count of Article Views (full-text article views including HTML views, PDF and ePub downloads, according to the available data) and Abstracts Views on Vision4Press platform.
Data correspond to usage on the plateform after 2015. The current usage metrics is available 48-96 hours after online publication and is updated daily on week days.
Initial download of the metrics may take a while.