Fig. 3.
Download original image
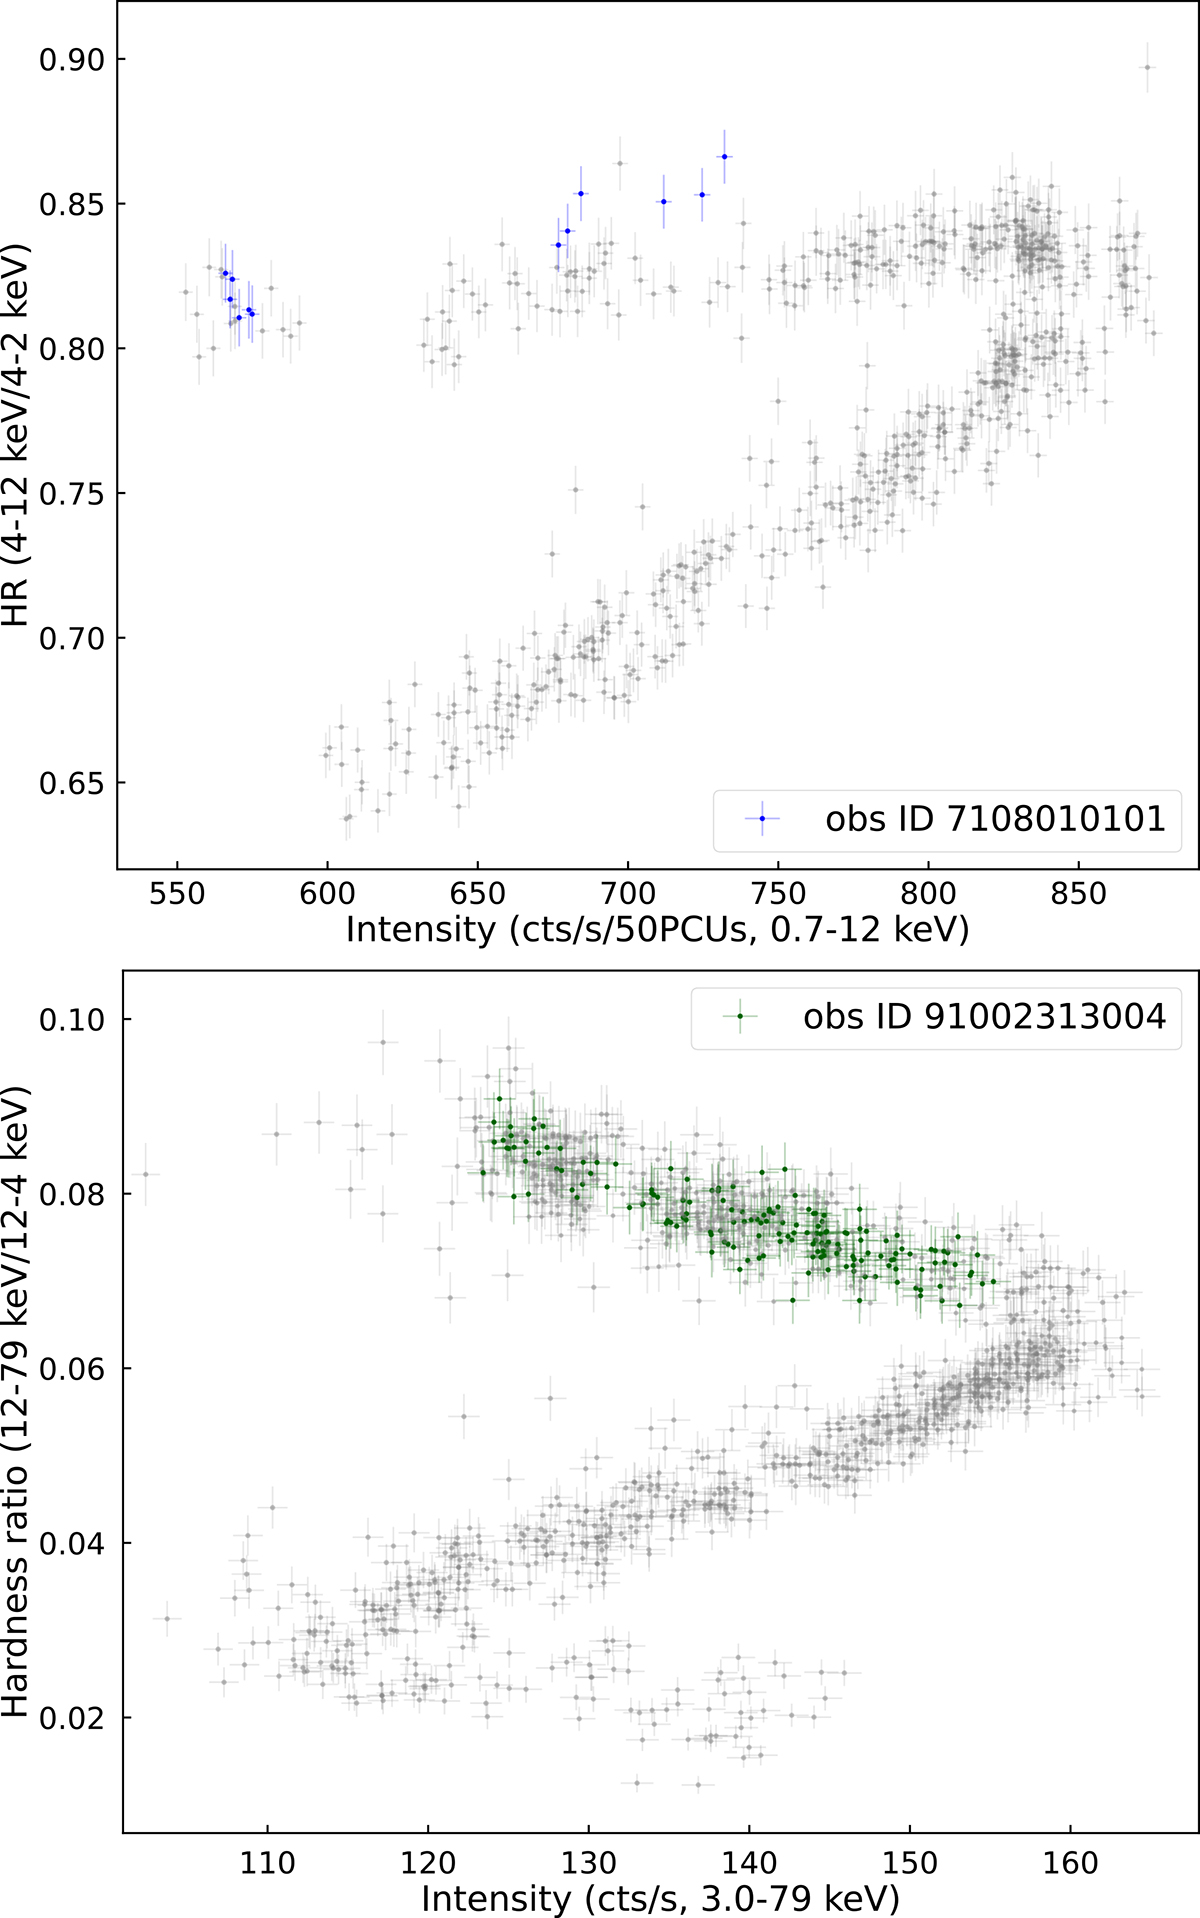
Hardness-Intensity Diagram of GX 340+0. Top panel: HID of GX 340+0 from the NICER data archive (gray points). The blue points represent the NICER observation analyzed here. Bottom panel: HID of GX 340+0 from the NuSTAR archival data (gray points). The green points represent the NuSTAR observation analyzed here. In both the NICER and NuSTAR observations analyzed here, GX 340+0 is in the HB, the same state as observed by IXPE.
Current usage metrics show cumulative count of Article Views (full-text article views including HTML views, PDF and ePub downloads, according to the available data) and Abstracts Views on Vision4Press platform.
Data correspond to usage on the plateform after 2015. The current usage metrics is available 48-96 hours after online publication and is updated daily on week days.
Initial download of the metrics may take a while.