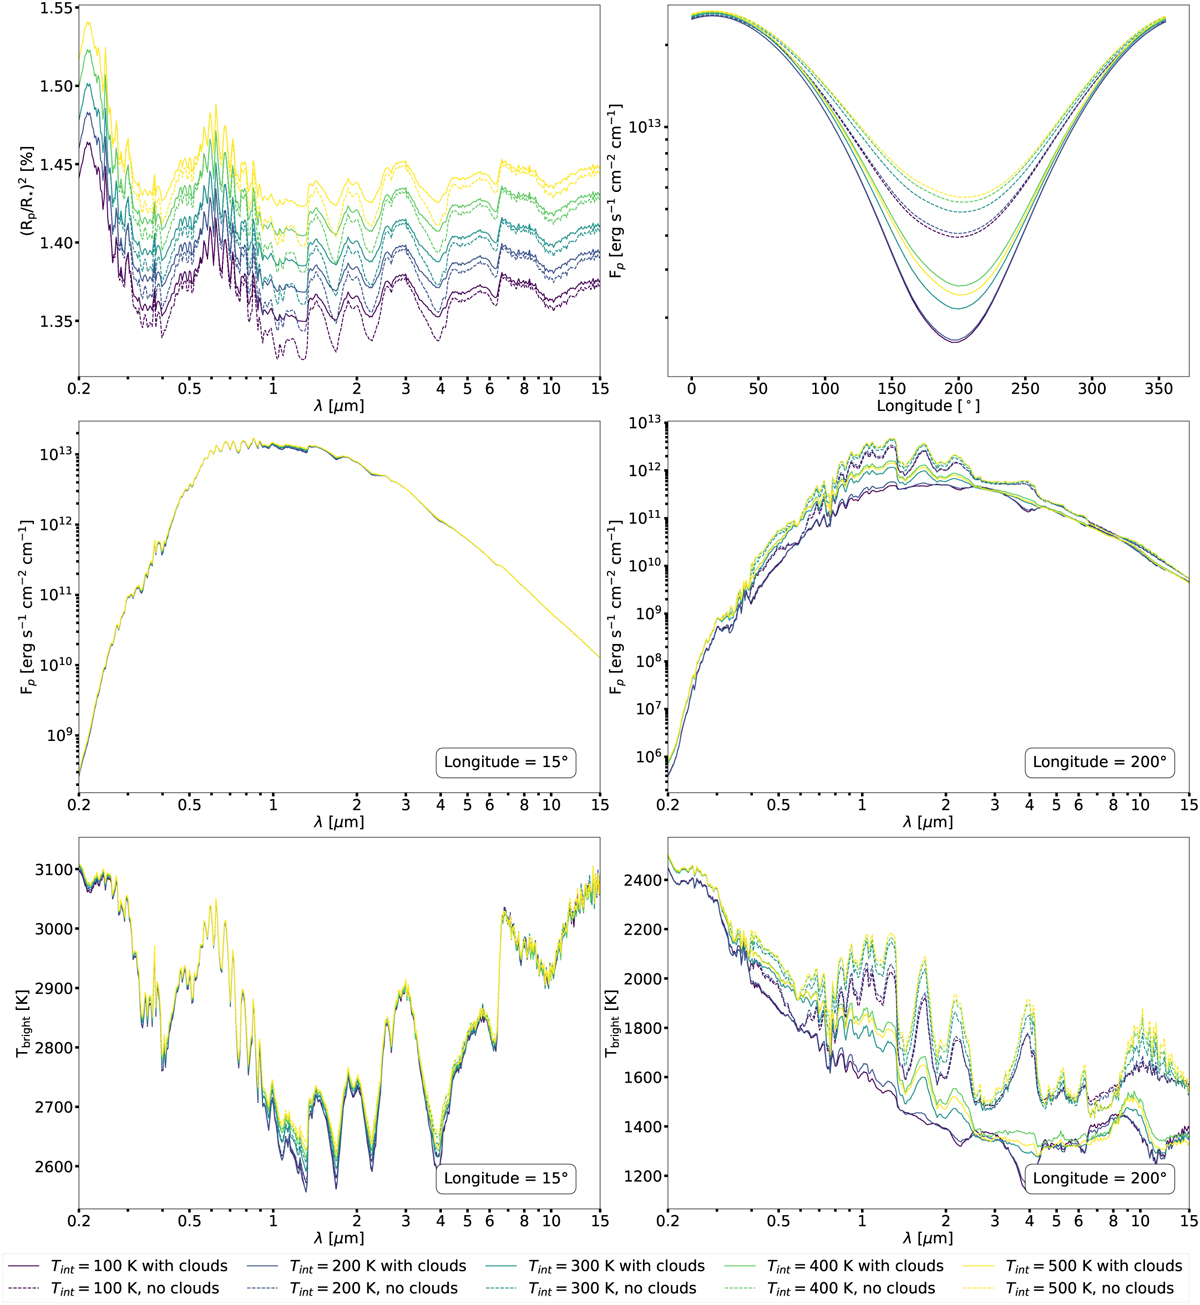
Fig. 7
Download original image
Transmission spectra (top left), phase curves (top right), planetary spectral flux at a longitudinal viewing angle of 15° (center left) and 195° (center right), and brightness temperature at a longitudinal viewing angle of 15° (lower left) and 195° (lower right) based on the post-processing of the GCM simulations. The line styles denote post-processing with (solid) and without (dashed) cloud opacity.
Current usage metrics show cumulative count of Article Views (full-text article views including HTML views, PDF and ePub downloads, according to the available data) and Abstracts Views on Vision4Press platform.
Data correspond to usage on the plateform after 2015. The current usage metrics is available 48-96 hours after online publication and is updated daily on week days.
Initial download of the metrics may take a while.