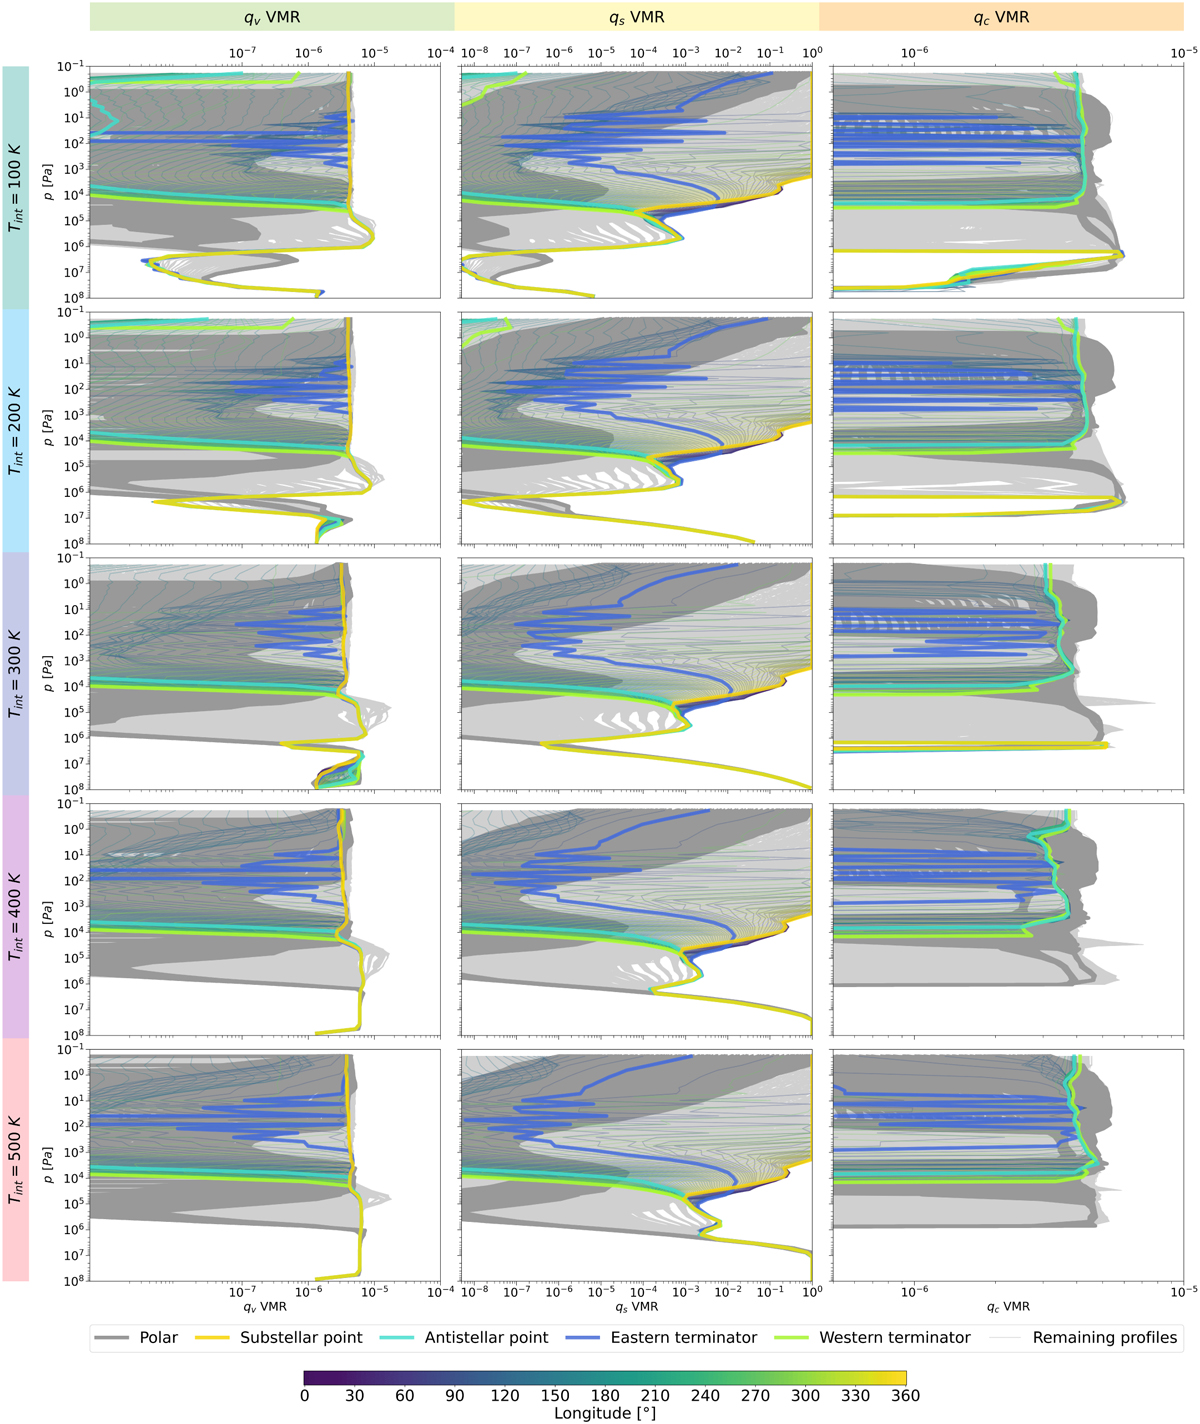
Fig. 3
Download original image
qv (first column), qs (second column), and qc profiles (third column) for each simulation. The coloured lines indicate T–p profiles along the equator and the colourbar indicate its coordinates. The dark grey lines show T–p profiles at the latitudes 87°N and 87°S. The bold coloured lines represent T–p profiles at the western and eastern terminators, and the sub-stellar and anti-stellar points. The lighter grey lines represents all other T–p profiles.
Current usage metrics show cumulative count of Article Views (full-text article views including HTML views, PDF and ePub downloads, according to the available data) and Abstracts Views on Vision4Press platform.
Data correspond to usage on the plateform after 2015. The current usage metrics is available 48-96 hours after online publication and is updated daily on week days.
Initial download of the metrics may take a while.