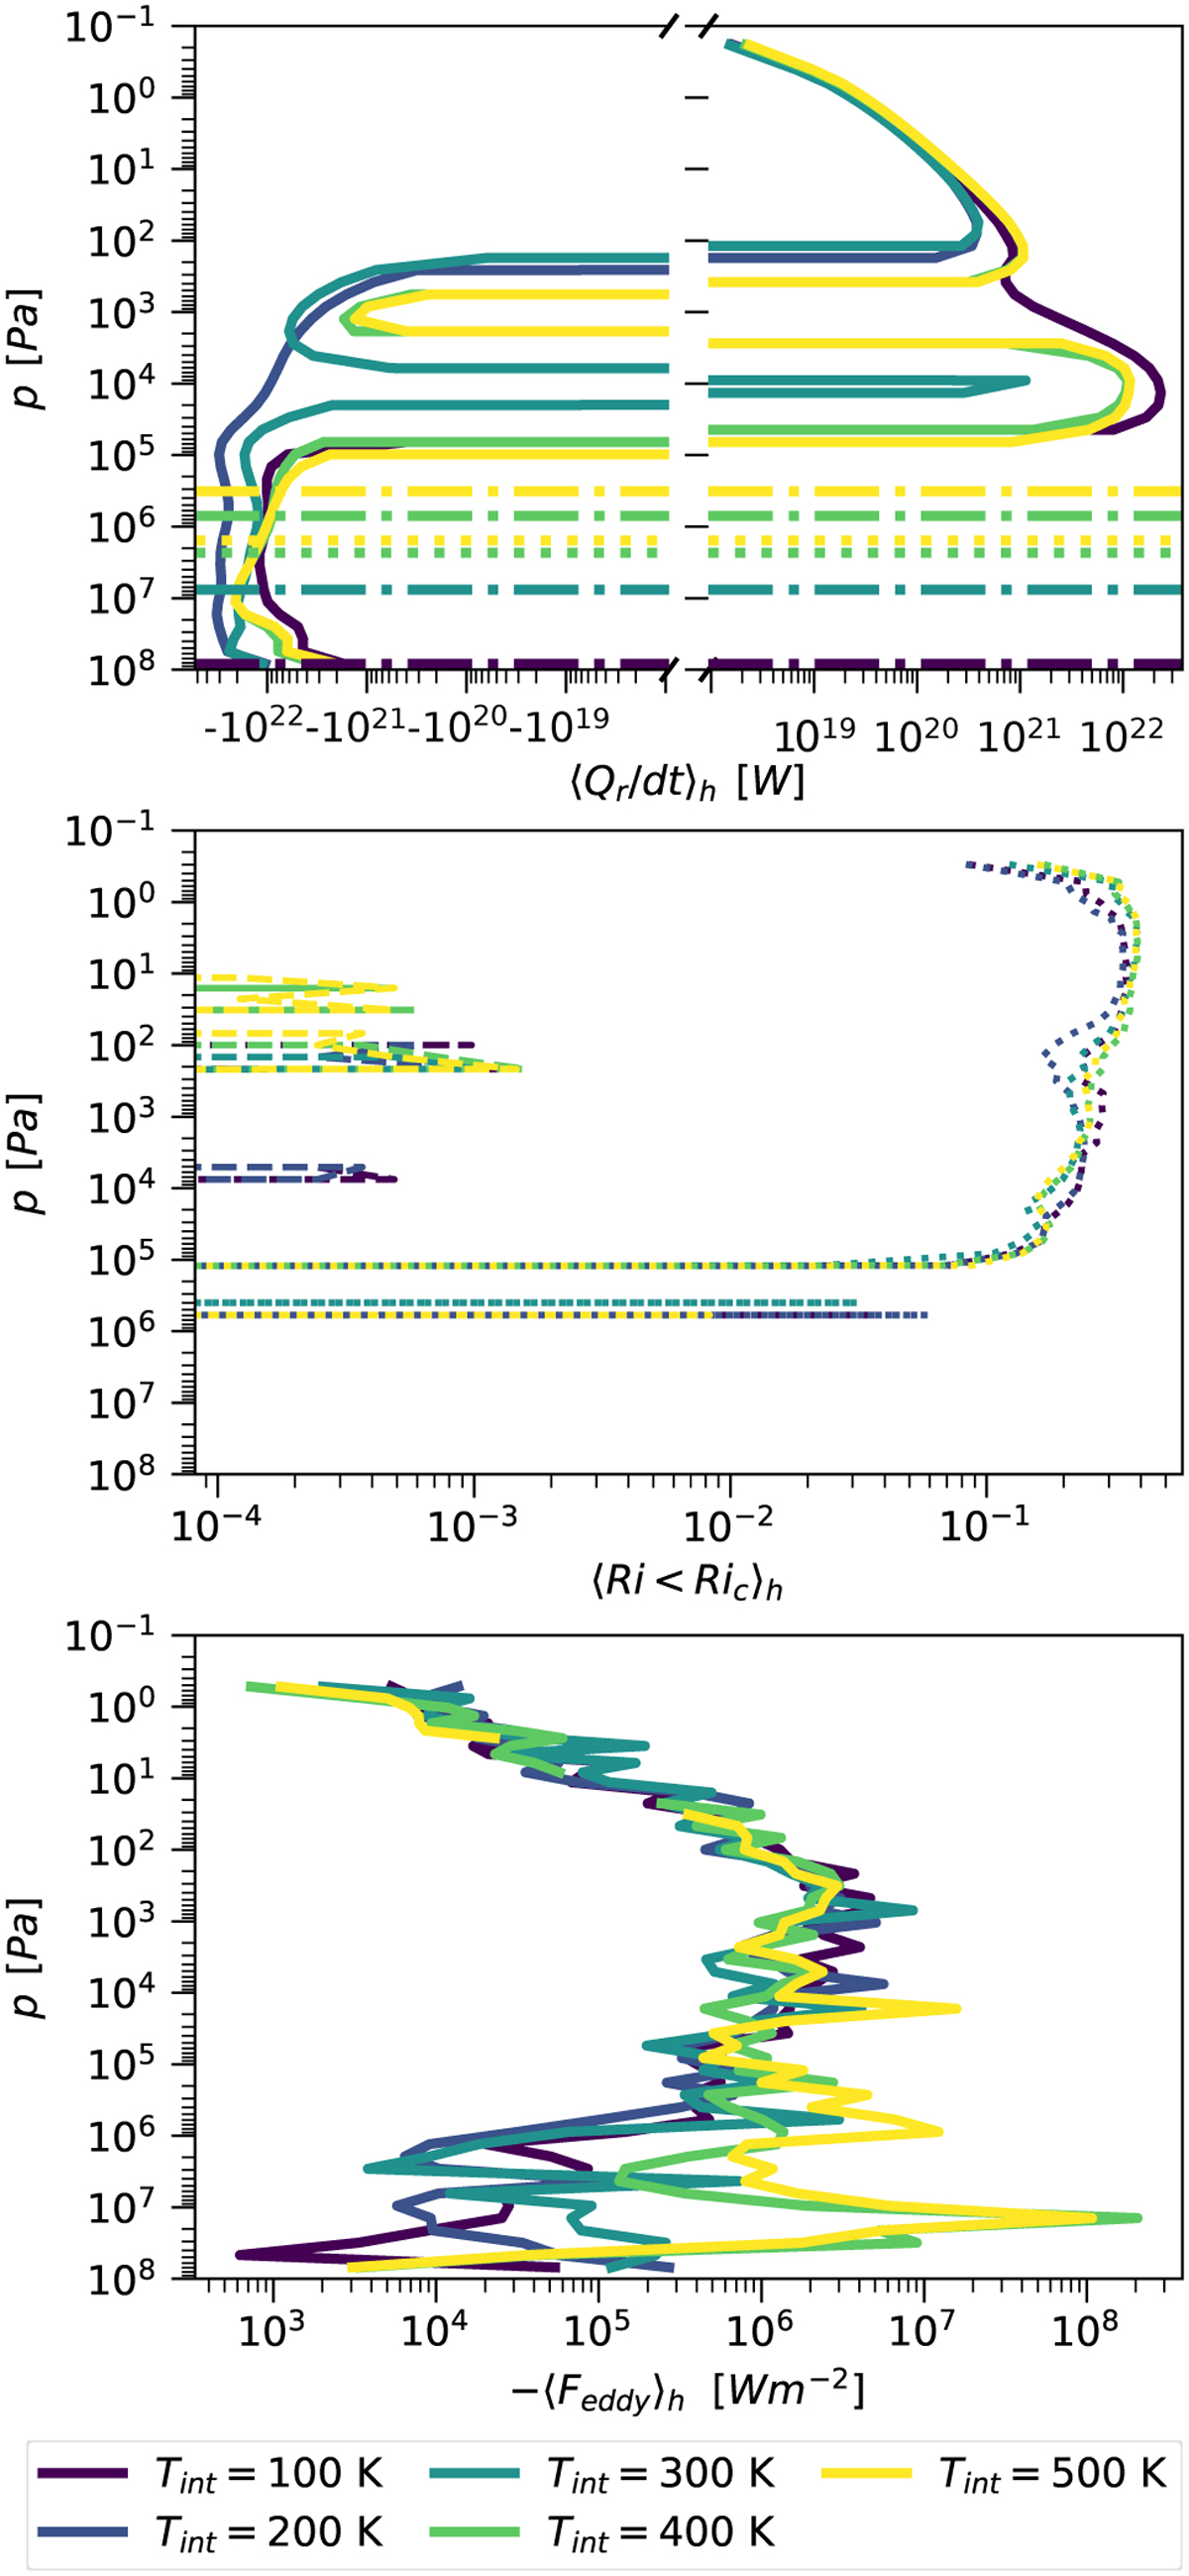
Fig. 2
Download original image
Vertical heat flow ⟨Qr/dt⟩h in the first row (upward heat flow is positive); horizontally averaged Miles instability condition profiles ⟨Ri < Ric⟩h in the second row; and horizontally averaged absolute vertical turbulent heat flux −⟨Feddy⟩h in the third row. The coloured lines indicate the simulations with different Tint. The horizontal lines in the top figure show the lowest pressure of the near-adiabatic lines. The dotted and dash-dotted lines in the top figure respectively indicate the equatorial RCBs and the shallowest RCB for the related Tint. The solid, dashed, and dotted lines indicate Ric with 0.25, 1, and 10, respectively. The dashed and solid lines indicate the −⟨Feddy⟩h calculated with the advective and the total Kzz, respectively.
Current usage metrics show cumulative count of Article Views (full-text article views including HTML views, PDF and ePub downloads, according to the available data) and Abstracts Views on Vision4Press platform.
Data correspond to usage on the plateform after 2015. The current usage metrics is available 48-96 hours after online publication and is updated daily on week days.
Initial download of the metrics may take a while.