Fig. 1
Download original image
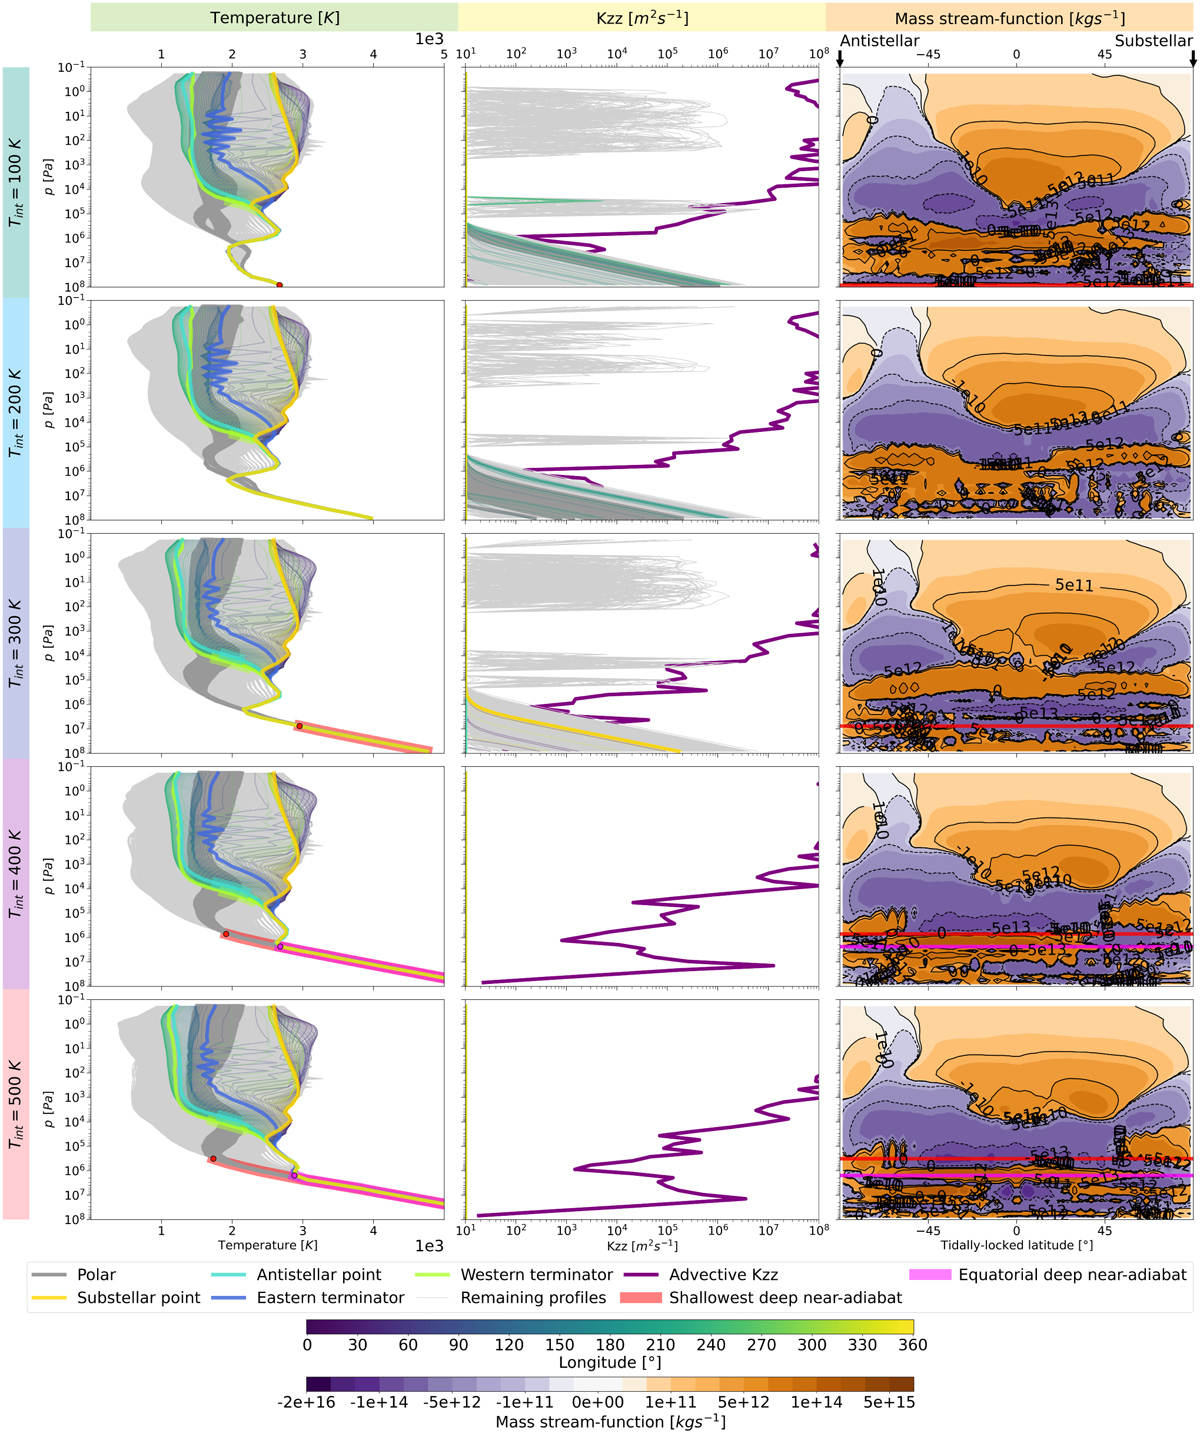
T–p profiles (first column), convective and advective Kzz profiles (second column), and overturning circulation depicted by the mass stream-function Ψ′ (third column) for each simulation. The coloured lines indicate vertical profiles along the equator and the colourbar indicate its coordinates. The dark grey lines show the T–p profiles at latitudes 87°N and 87°S. The bold coloured lines represent profiles at the western and eastern terminators, and sub-stellar and anti-stellar points. The lighter grey lines represent all other vertical profiles. The shaded area indicates the adiabatic regions. The red and magenta shaded area represent the shallowest adiabatic RCB profiles respectively along the equator. The points in column 1 and the horizontal lines in Column 3 show the lowest pressure of the near-adiabatic lines. The purple line in Column 2 shows the absolute advective |Kzz| according Equation (1). The stream-function shows anti-clockwise and clockwise circulations in orange and in purple, respectively.
Current usage metrics show cumulative count of Article Views (full-text article views including HTML views, PDF and ePub downloads, according to the available data) and Abstracts Views on Vision4Press platform.
Data correspond to usage on the plateform after 2015. The current usage metrics is available 48-96 hours after online publication and is updated daily on week days.
Initial download of the metrics may take a while.