Fig. 3
Download original image
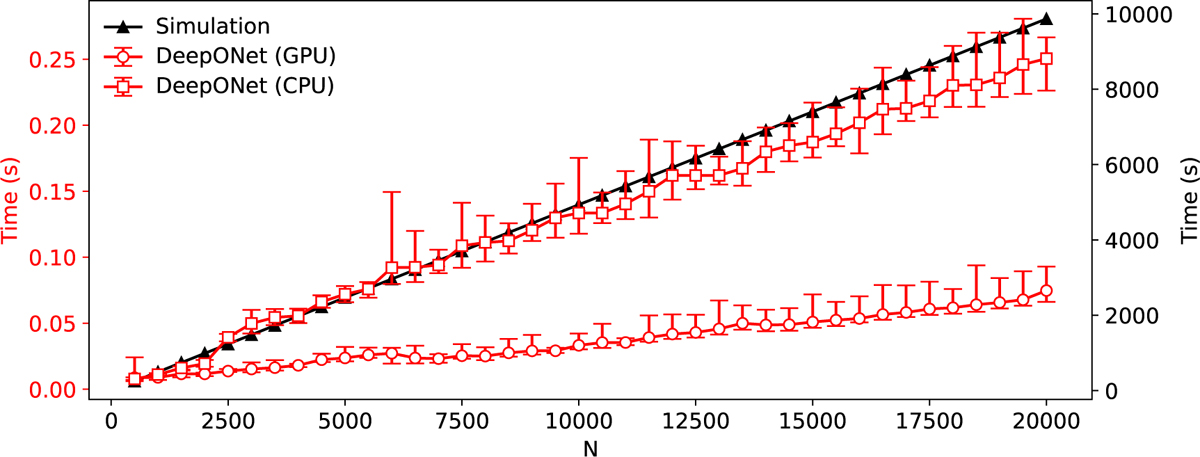
Time cost of DeepONet and traditional numerical simulation as a function of number of facets. The red line consisting of error bars centered around circles represents the time cost required by DeepONet in GPU and the red line consisting of error bars centered around squares represents the time cost required by DeepONet in CPU. The black line is the time cost required by traditional numerical simulation.
Current usage metrics show cumulative count of Article Views (full-text article views including HTML views, PDF and ePub downloads, according to the available data) and Abstracts Views on Vision4Press platform.
Data correspond to usage on the plateform after 2015. The current usage metrics is available 48-96 hours after online publication and is updated daily on week days.
Initial download of the metrics may take a while.