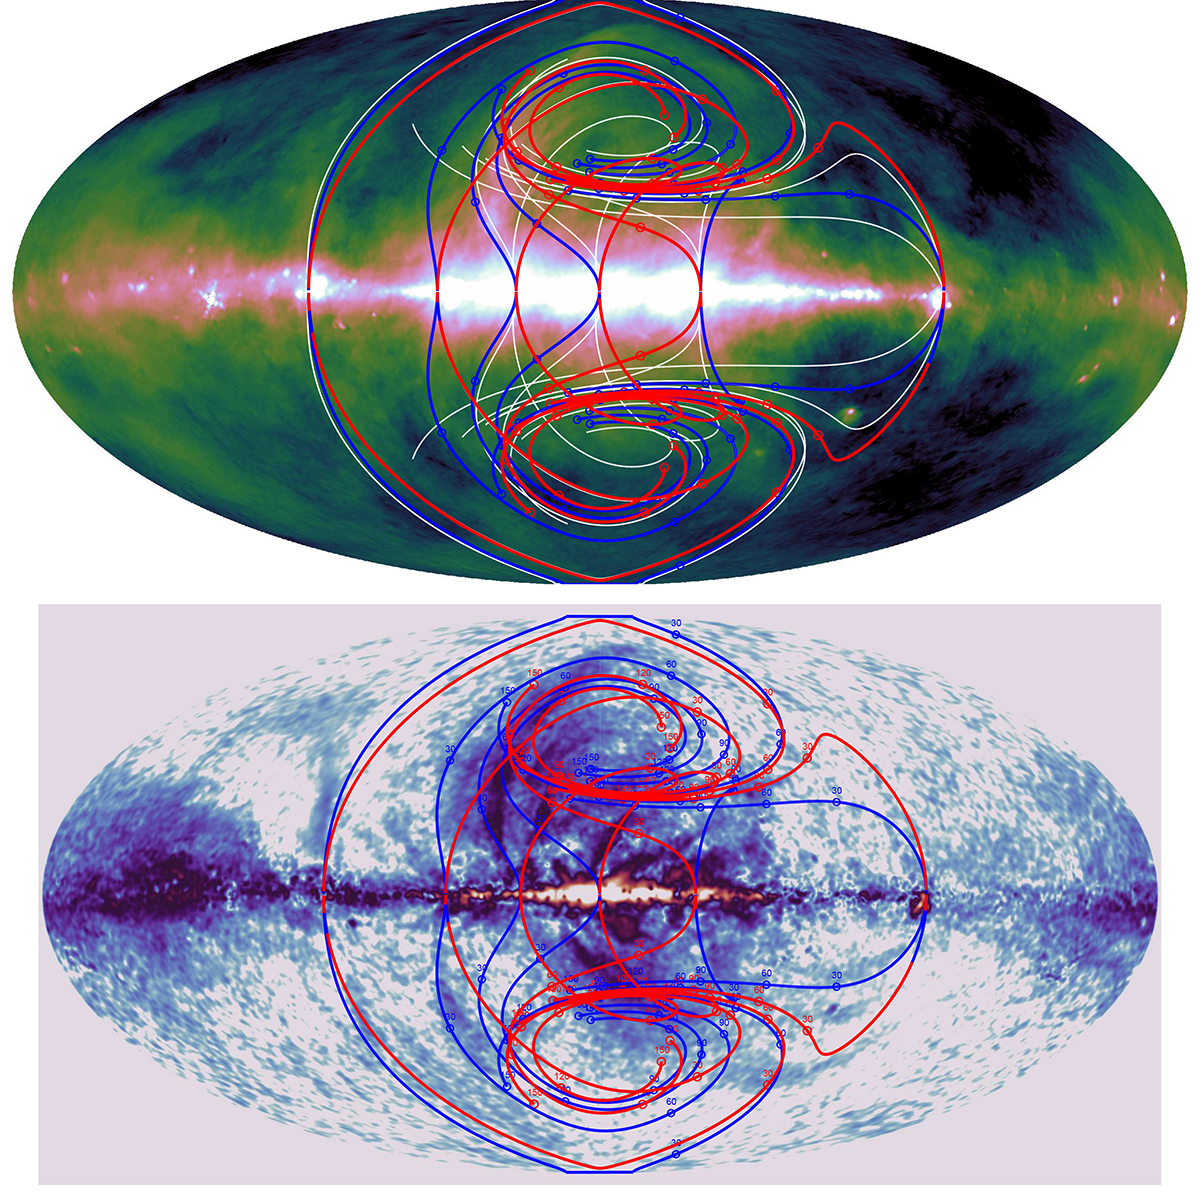
Fig. D.1.
Download original image
Trajectories of the gaseous plumes in Aitoff projection. Top: Sample trajectories of the gaseous plumes superposed on the radio continuum map at 408 MHz map (Haslam et al. 1981; Remazeilles et al. 2015). These trajectories correspond to an arbitrarily chosen set of plume "sources" (see Table B.1). Red and blue correspond to cases when sources have the same azimuthal velocity in the disk as stars. They correspond to the plume sources currently observed at a given Galactic longitude but different distances from the Sun: red and blue mark sources that are closer and farther away, respectively. White corresponds to sources that move with the pattern speed. Three properties of the trajectories are worth mentioning: (i) the "spirals" are warped in the central region of the Galaxy well above the plane, (ii) the east–west asymmetry set by the Galaxy rotation direction, and (iii) trajectories tend to overlap in certain regions of the sky even if they come from well-separated sources. Bottom: Polarized synchrotron emission map (e.g., Planck Collaboration IV 2020) with a subset of trajectories superposed. The circles correspond to time tags (every 30 Myr) in this model and are labeled.
Current usage metrics show cumulative count of Article Views (full-text article views including HTML views, PDF and ePub downloads, according to the available data) and Abstracts Views on Vision4Press platform.
Data correspond to usage on the plateform after 2015. The current usage metrics is available 48-96 hours after online publication and is updated daily on week days.
Initial download of the metrics may take a while.