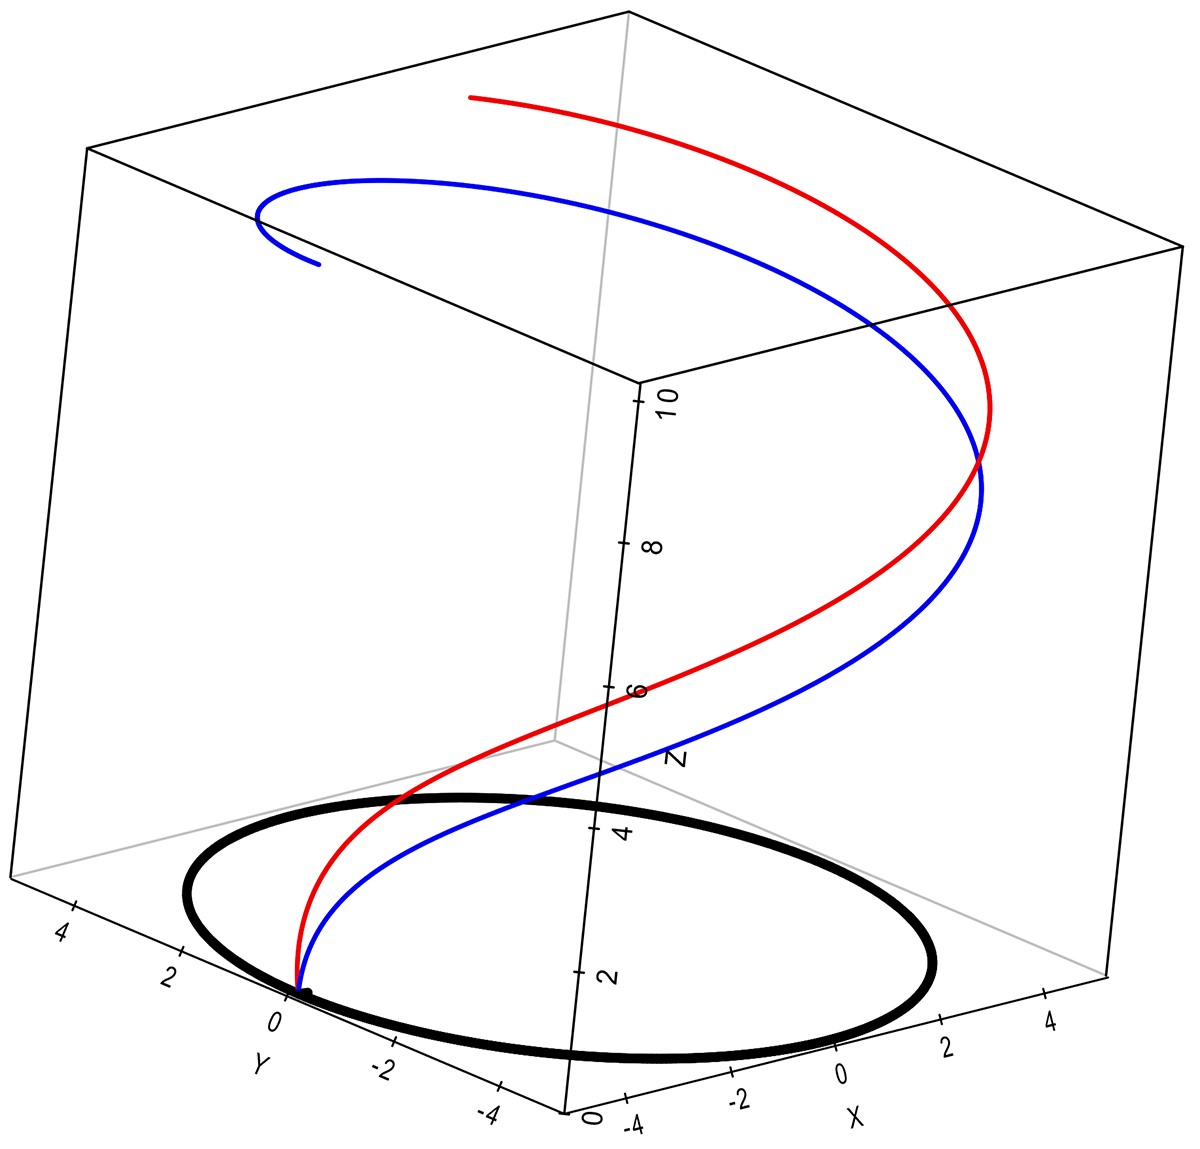
Fig. B.1.
Download original image
Example of a 3D trajectory of a plume rising above the disk according to Eqs. 1 and 2 and integrated over 140 Myr. Only one side of the plume is shown. The black circle depicts a circle in the disk plane with a radius of ∼5 kpc. The blue line corresponds to case (a), namely the source of the plume moves together with the gas and stars in the disk plane. The red curve is case (b), when the source of the plume, i.e., an area of active star formation, moves relative to the gas. At this distance from the GC, the difference between these two cases is not large.
Current usage metrics show cumulative count of Article Views (full-text article views including HTML views, PDF and ePub downloads, according to the available data) and Abstracts Views on Vision4Press platform.
Data correspond to usage on the plateform after 2015. The current usage metrics is available 48-96 hours after online publication and is updated daily on week days.
Initial download of the metrics may take a while.