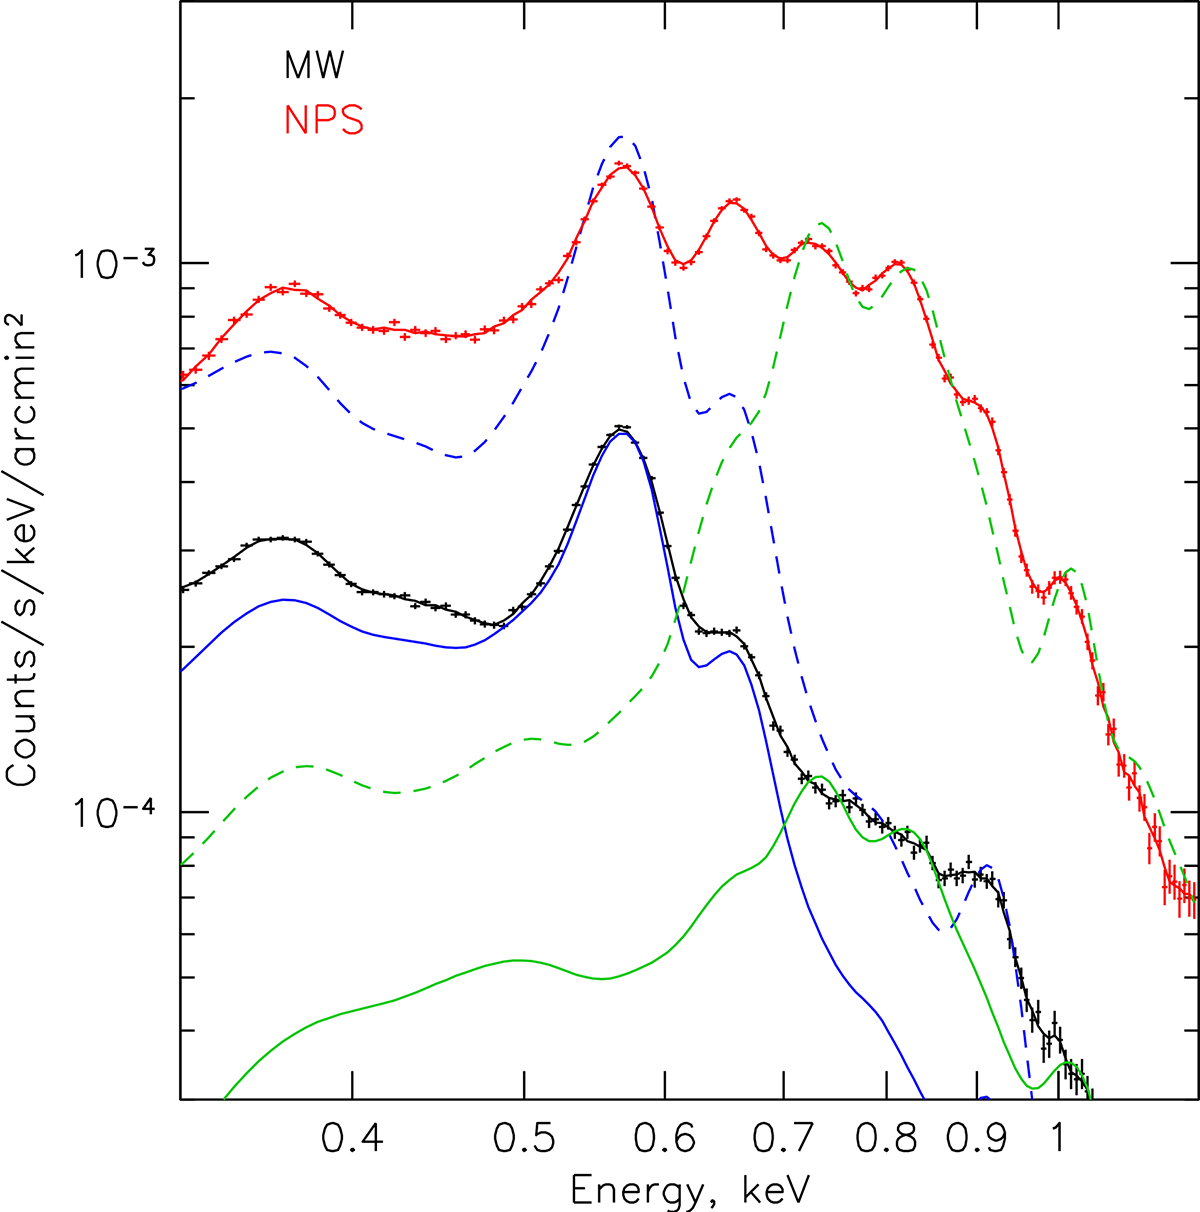
Fig. A.1.
Download original image
Spectrum of a large region inside the NPS (red points) in comparison with the typical "Milky Way" spectrum well outside the NPS (black points). Contributions of the detector background and CXB have been subtracted. The blue and green lines illustrate a few characteristic models. The solid blue line shows the APEC spectrum with the temperature Tw = 0.16 keV and abundance Z/Z⊙ = 0.05, using the abundance ratios from Asplund et al. (2009). The dashed blue line shows the same model with a three times larger abundance, i.e., Z/Z⊙ = 0.15. The solid green line shows the APEC model with the temperature Th = 0.5 keV, Z/Z⊙ = 0.05, and the emission measure multiplied by a factor of (Tw/Th)2. The dashed green line shows the same model with Z/Z⊙ = 0.7. A comparison of the histograms and the dashed lines shows that overabundances in the range 3-10 are needed to reproduce the enhanced brightness of the NPS compared to the Galaxy (assuming comparable pressures and linear sizes of the emitting regions).
Current usage metrics show cumulative count of Article Views (full-text article views including HTML views, PDF and ePub downloads, according to the available data) and Abstracts Views on Vision4Press platform.
Data correspond to usage on the plateform after 2015. The current usage metrics is available 48-96 hours after online publication and is updated daily on week days.
Initial download of the metrics may take a while.