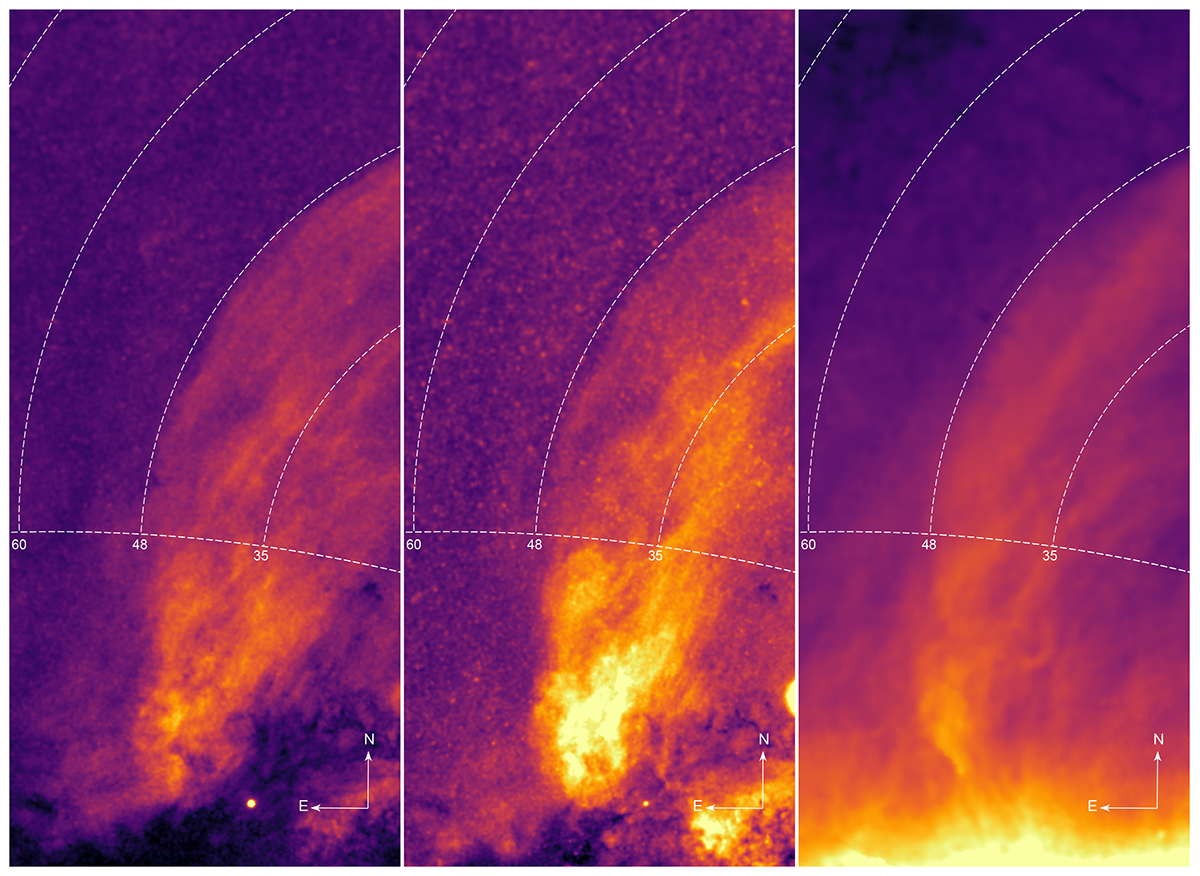
Fig. 1.
Download original image
X-ray and radio images of the NPS region. Left and middle panels: 0.52−0.61 keV and 0.7−0.96 keV eROSITA X-ray images, respectively. For comparison, the right panel shows the 408 MHz radio image from the all-sky continuum surveys (Haslam et al. 1981; Remazeilles et al. 2015). The images in galactic coordinates are shown in stereographic projection for a better view of the regions near the Galactic plane and the Galactic north pole. The X-ray images are particle-background-subtracted and exposure-corrected. The brightest compact sources and galaxy clusters have been masked, and the resulting image convolved with σ = 20′ Gaussian. Still prominently visible in the image are RS Oph (bright dot near the bottom of the left image) and the stray light halo around Sco X-1 (at the right edge of the middle image). The dashed white lines show the wedge used to extract radial profiles. The numbers indicate the distance (in degrees) from the wedge center, which is at (l, b) = (338 ° ,32 ° ) in Galactic coordinates.
Current usage metrics show cumulative count of Article Views (full-text article views including HTML views, PDF and ePub downloads, according to the available data) and Abstracts Views on Vision4Press platform.
Data correspond to usage on the plateform after 2015. The current usage metrics is available 48-96 hours after online publication and is updated daily on week days.
Initial download of the metrics may take a while.