Open Access
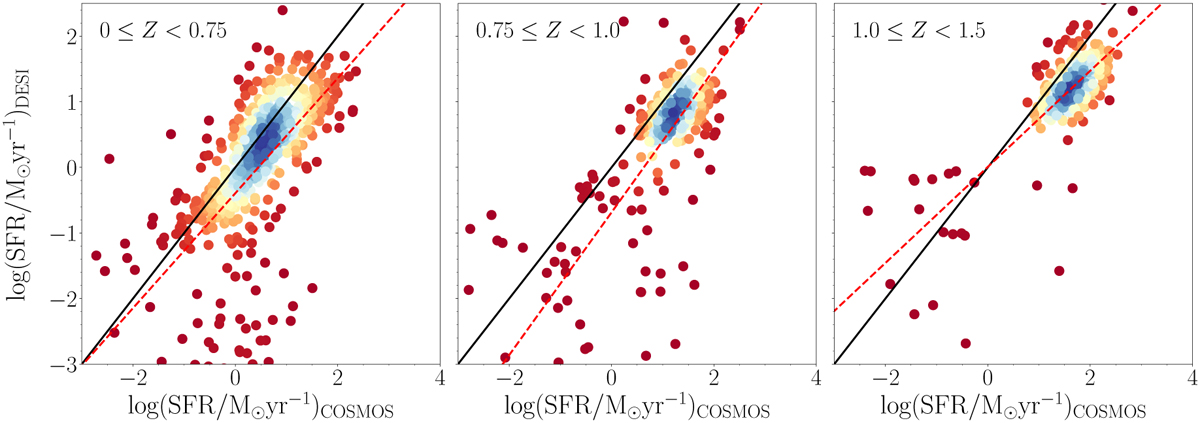
Fig. 8
Download original image
Comparison of SFR estimates from our DESI VAC and COSMOS2020(FARMER; Weaver et al. 2022) catalog in three redshift bins. The 1:1 and ±0.2 dex lines are marked with black solid and dashed lines, respectively. The linear fit (red line) and the Pearson correlation coefficient are reported in the legend.
Current usage metrics show cumulative count of Article Views (full-text article views including HTML views, PDF and ePub downloads, according to the available data) and Abstracts Views on Vision4Press platform.
Data correspond to usage on the plateform after 2015. The current usage metrics is available 48-96 hours after online publication and is updated daily on week days.
Initial download of the metrics may take a while.