Fig. 6
Download original image
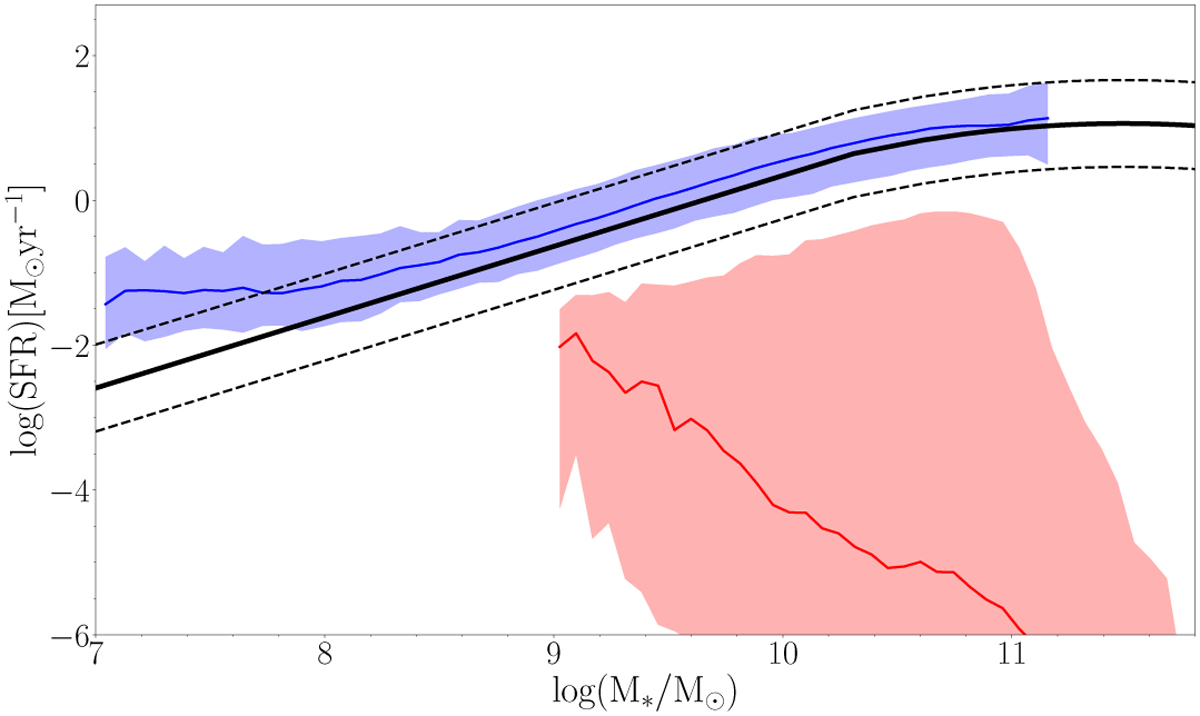
Mstar – SFR relation for BGS galaxies. The MS at z ~ 0.24 (median redshift of the BGS sample) according to Schreiber et al. (2015) is shown with a black solid line, while dashed lines correspond to MS ± 0.6 dex to represent starburst and passive galaxies. The running median and 16th-84th percentile range for red and blue galaxies selected based on the UVJ criterion are marked with red and blue, respectively.
Current usage metrics show cumulative count of Article Views (full-text article views including HTML views, PDF and ePub downloads, according to the available data) and Abstracts Views on Vision4Press platform.
Data correspond to usage on the plateform after 2015. The current usage metrics is available 48-96 hours after online publication and is updated daily on week days.
Initial download of the metrics may take a while.