Open Access
Fig. 2
Download original image
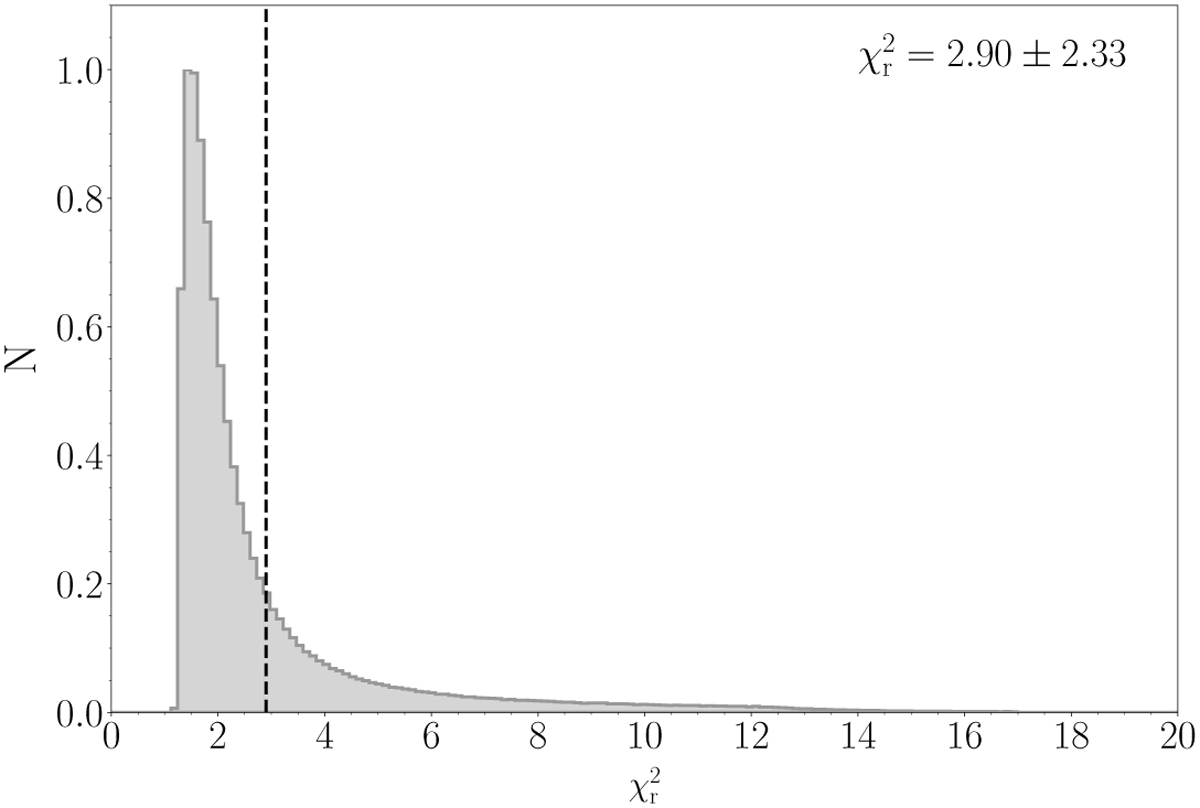
Distribution of the ![]() for the DESI EDR SED fits. The mean and standard deviation of
for the DESI EDR SED fits. The mean and standard deviation of ![]() are reported in the legend. The dashed line corresponds to the mean
are reported in the legend. The dashed line corresponds to the mean ![]() . At least ~ 88% of the sample is characterized by robust fits (defined as
. At least ~ 88% of the sample is characterized by robust fits (defined as ![]() < 5):
< 5):
Current usage metrics show cumulative count of Article Views (full-text article views including HTML views, PDF and ePub downloads, according to the available data) and Abstracts Views on Vision4Press platform.
Data correspond to usage on the plateform after 2015. The current usage metrics is available 48-96 hours after online publication and is updated daily on week days.
Initial download of the metrics may take a while.