Fig. C.2
Download original image
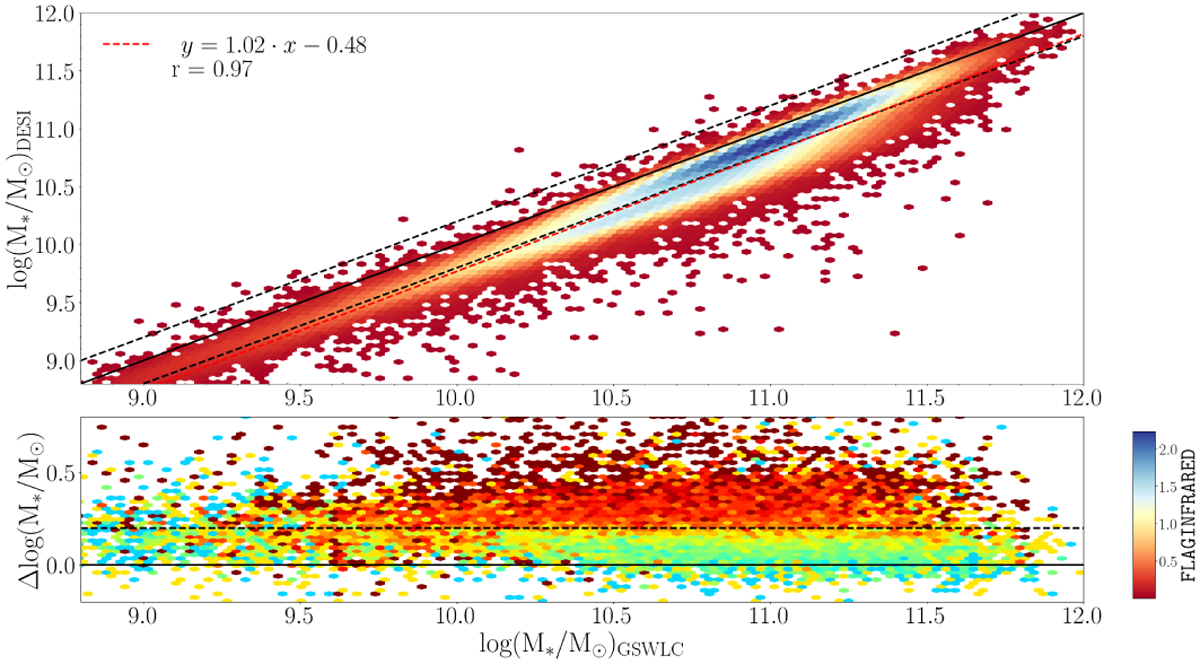
Comparison of ~18,000 stellar mass estimates from our VAC and GSWLC 2 catalogs (top panel) and difference in stellar mass estimates (bottom panel). The 1:1 and 0.2 dex lines are marked with black solid and dashed lines, respectively. The linear fit (red line) and the Pearson correlation coefficient are reported in the legend. The bottom panel shows the dependence of the stellar mass residuals on the availability of WISE photometry expressed by FLAGINFRARED: the scatter increases when WISE photometry is readily available.
Current usage metrics show cumulative count of Article Views (full-text article views including HTML views, PDF and ePub downloads, according to the available data) and Abstracts Views on Vision4Press platform.
Data correspond to usage on the plateform after 2015. The current usage metrics is available 48-96 hours after online publication and is updated daily on week days.
Initial download of the metrics may take a while.