Fig. 15
Download original image
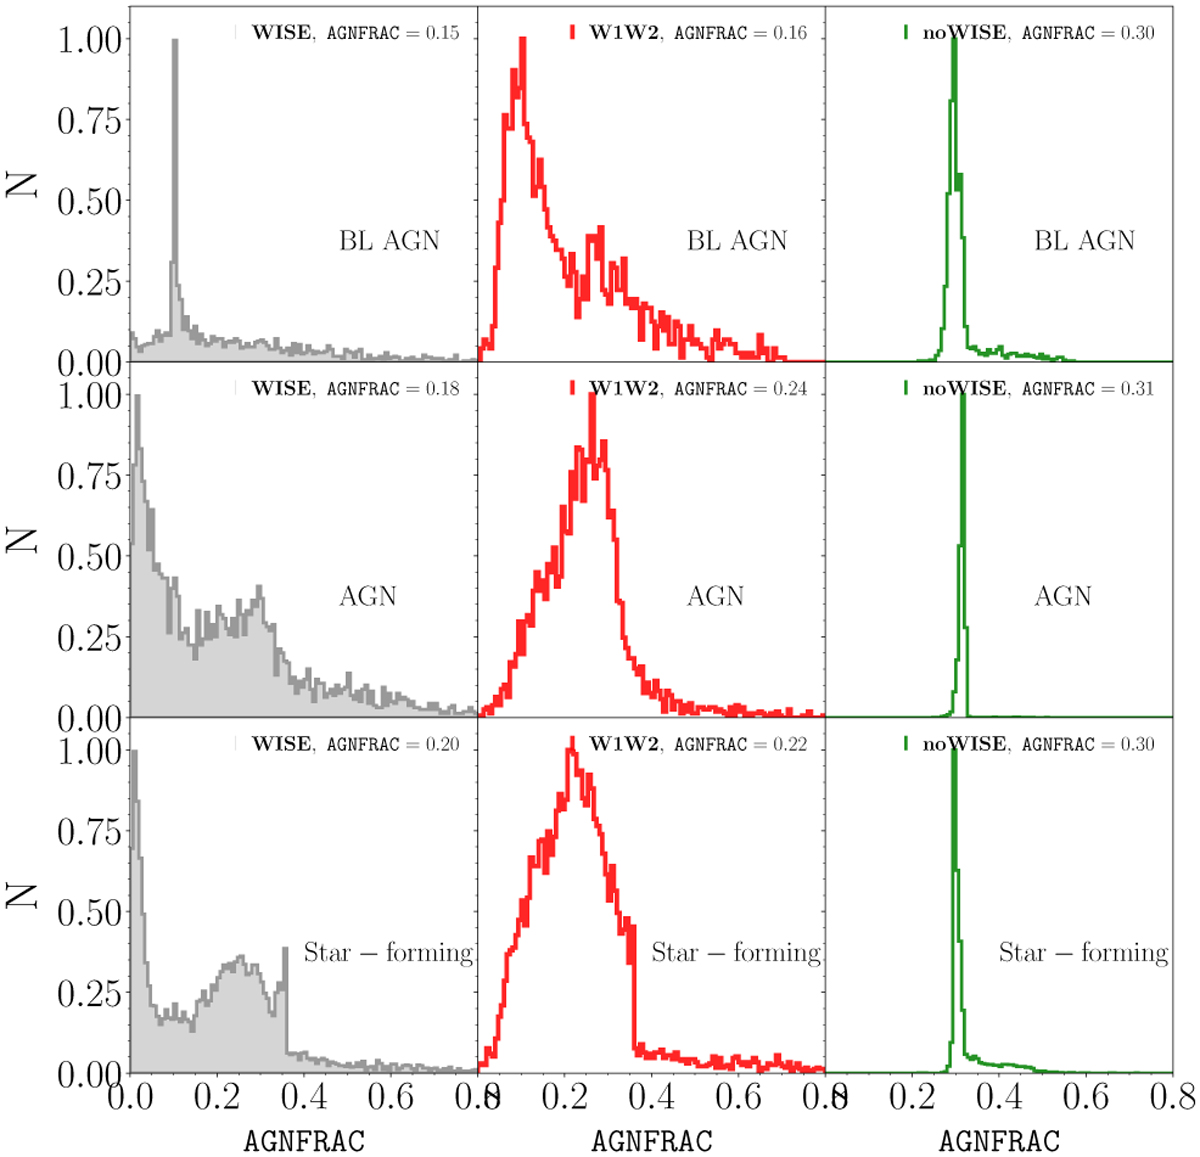
Comparison of the AGNFRAC distribution obtained from SED fits incorporating grzW14 bands (left panels), grzW12 (middle panels), and solely grz bands (right panels) for BL AGNs (top panels), NL AGNs (middle panels), and star-forming galaxies (bottom panels) drawn from the representative sample (see Appendix D.1). The number of sources and the median AGNFRAC are reported in the plots.
Current usage metrics show cumulative count of Article Views (full-text article views including HTML views, PDF and ePub downloads, according to the available data) and Abstracts Views on Vision4Press platform.
Data correspond to usage on the plateform after 2015. The current usage metrics is available 48-96 hours after online publication and is updated daily on week days.
Initial download of the metrics may take a while.