Fig. 12
Download original image
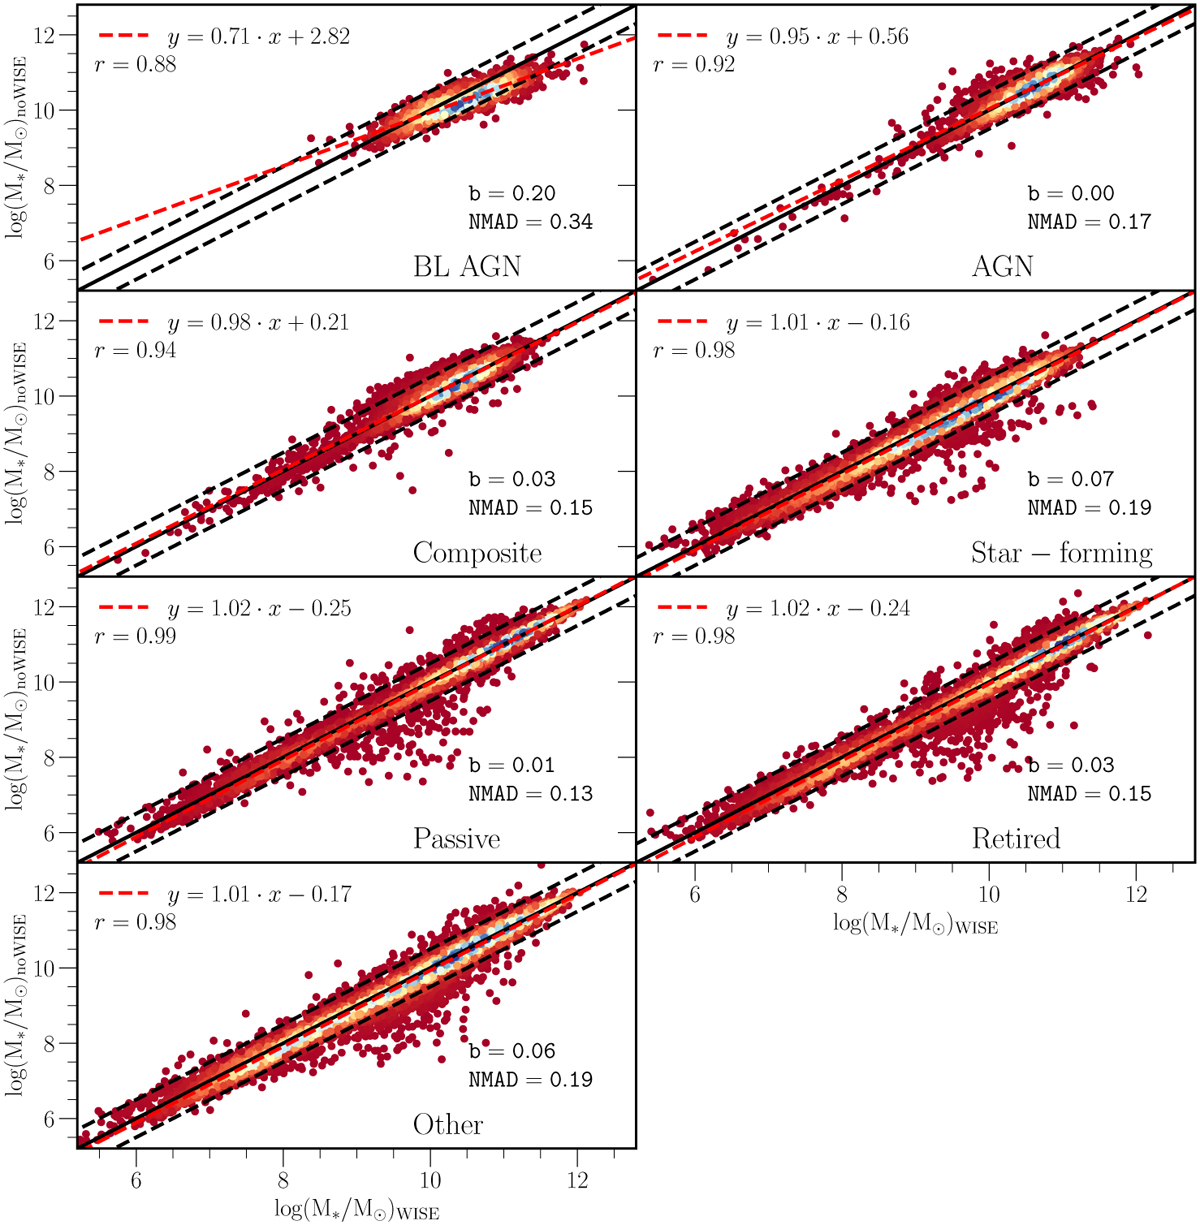
Comparison of stellar mass estimates with or without incorporation of the MIR photometry to the SED fitting for the representative sample composed of seven different galaxy classes. The 1:1 and ±0.5 dex lines are marked with black solid and dashed lines, respectively. The linear fit (red line) and the Pearson correlation coefficient (r) are reported in the legend. The median difference (Δ) and NMAD (see Sect. 5.1 for the definition of the metric) are reported on the plots for each galaxy class: BL and NL AGNs, composite objects, starforming galaxies, passive and retired galaxies, and other sources.
Current usage metrics show cumulative count of Article Views (full-text article views including HTML views, PDF and ePub downloads, according to the available data) and Abstracts Views on Vision4Press platform.
Data correspond to usage on the plateform after 2015. The current usage metrics is available 48-96 hours after online publication and is updated daily on week days.
Initial download of the metrics may take a while.