Fig. 9.
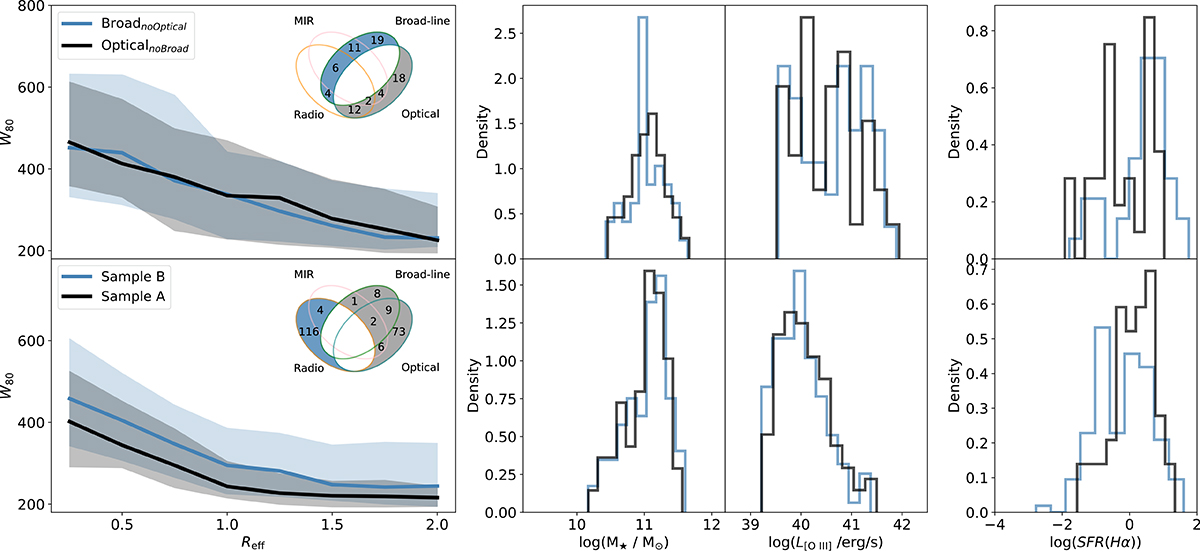
Download original image
Comparison of stacked W80 profiles and host galaxy properties between different AGN samples. The plots in the top and bottom rows show how both samples behave after they are matched to have the same log(M⋆) and log(L[O III]). The Venn diagrams shown in each W80 plot represent the AGN sample in the label. Top: Blue for optically selected (without broad-line-selected) and gray for the opposite. Bottom: Blue for sample B and gray for sample A. For each column of plots, from left to right, we show the W80 stacked radial profile, the log(M⋆) distribution, the log(L[O III]) distribution, and the log(SFR(Hα)) distribution.
Current usage metrics show cumulative count of Article Views (full-text article views including HTML views, PDF and ePub downloads, according to the available data) and Abstracts Views on Vision4Press platform.
Data correspond to usage on the plateform after 2015. The current usage metrics is available 48-96 hours after online publication and is updated daily on week days.
Initial download of the metrics may take a while.