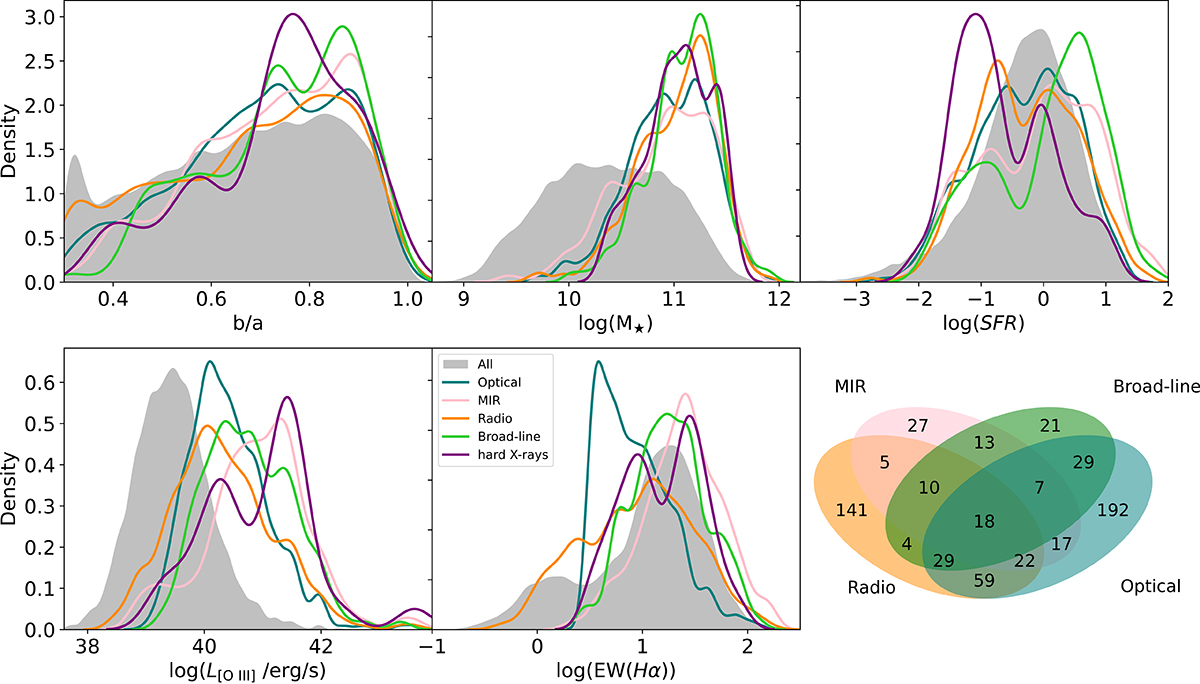
Fig. 4.
Download original image
Smooth histograms of multiple host galaxy properties. Top (left to right): b/a axis ratio, log(M⋆), and log(SFR) from Pipe3D. Bottom (left and middle plot): log(L[O III]) and log(EW(Hα)), both extracted from an aperture of 1 Reff, and (to the right) a complementary illustration for Table 2 employing Venn diagrams. In order to maintain visual clarity, the hard X-ray-selected AGN sample was intentionally omitted from the diagrams. The gray-shaded histogram shows the distribution of all MaNGA that pass our S/N criteria (see Sect. 3.2).
Current usage metrics show cumulative count of Article Views (full-text article views including HTML views, PDF and ePub downloads, according to the available data) and Abstracts Views on Vision4Press platform.
Data correspond to usage on the plateform after 2015. The current usage metrics is available 48-96 hours after online publication and is updated daily on week days.
Initial download of the metrics may take a while.