Fig. 3.
Download original image
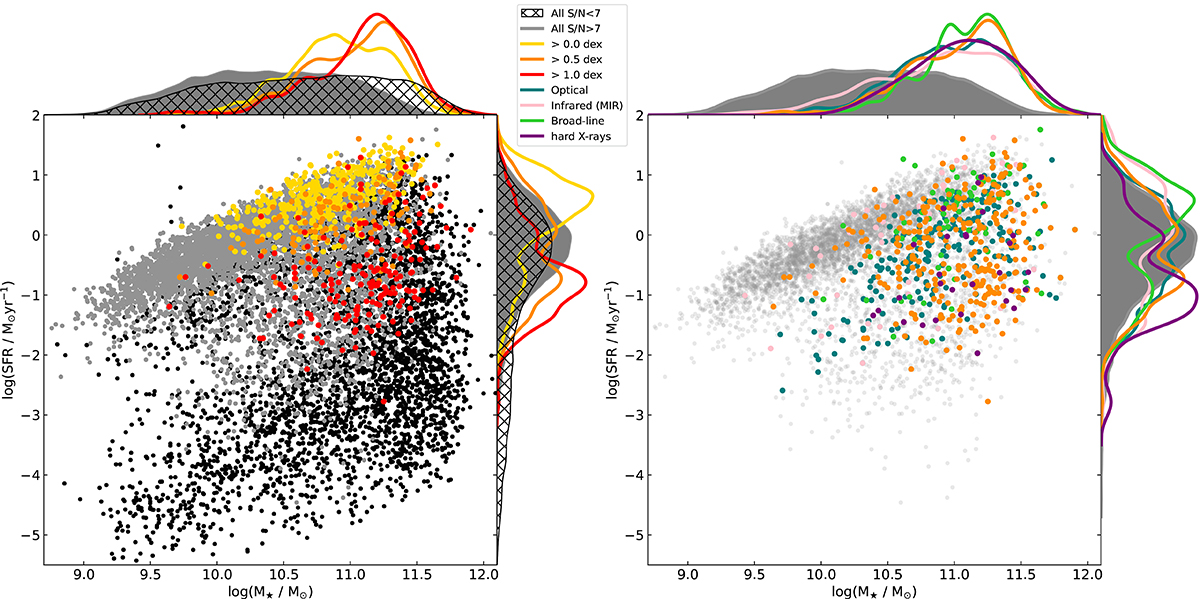
Stellar mass versus star formation rates of MaNGA host galaxies. The left panel shows the impact of our quality criteria (see Sect. 3.2), excluding galaxies with higher stellar mass and lower star formation rates (represented by the black dots in the scatter plot and hatched black distribution in the top and right-hand diagrams). In red, orange, and yellow, we show the distribution of the AGN candidates selected by radio (using 0.0, 0.5, and 1.0 dex of excess; see Sect. 2.2.4) that satisfy the S/N quality criteria. To understand the properties of the excluded radio-selected hosts, we encourage the reader to look at Fig. 1. It can be seen that a long tail of deficient SFR hosts are excluded (−2> log(SFR(Hα)) > −4). On the right, we show only the galaxies chosen after the quality criteria and their corresponding AGN classifications. We have provided labels for each color in a panel between both plots.
Current usage metrics show cumulative count of Article Views (full-text article views including HTML views, PDF and ePub downloads, according to the available data) and Abstracts Views on Vision4Press platform.
Data correspond to usage on the plateform after 2015. The current usage metrics is available 48-96 hours after online publication and is updated daily on week days.
Initial download of the metrics may take a while.