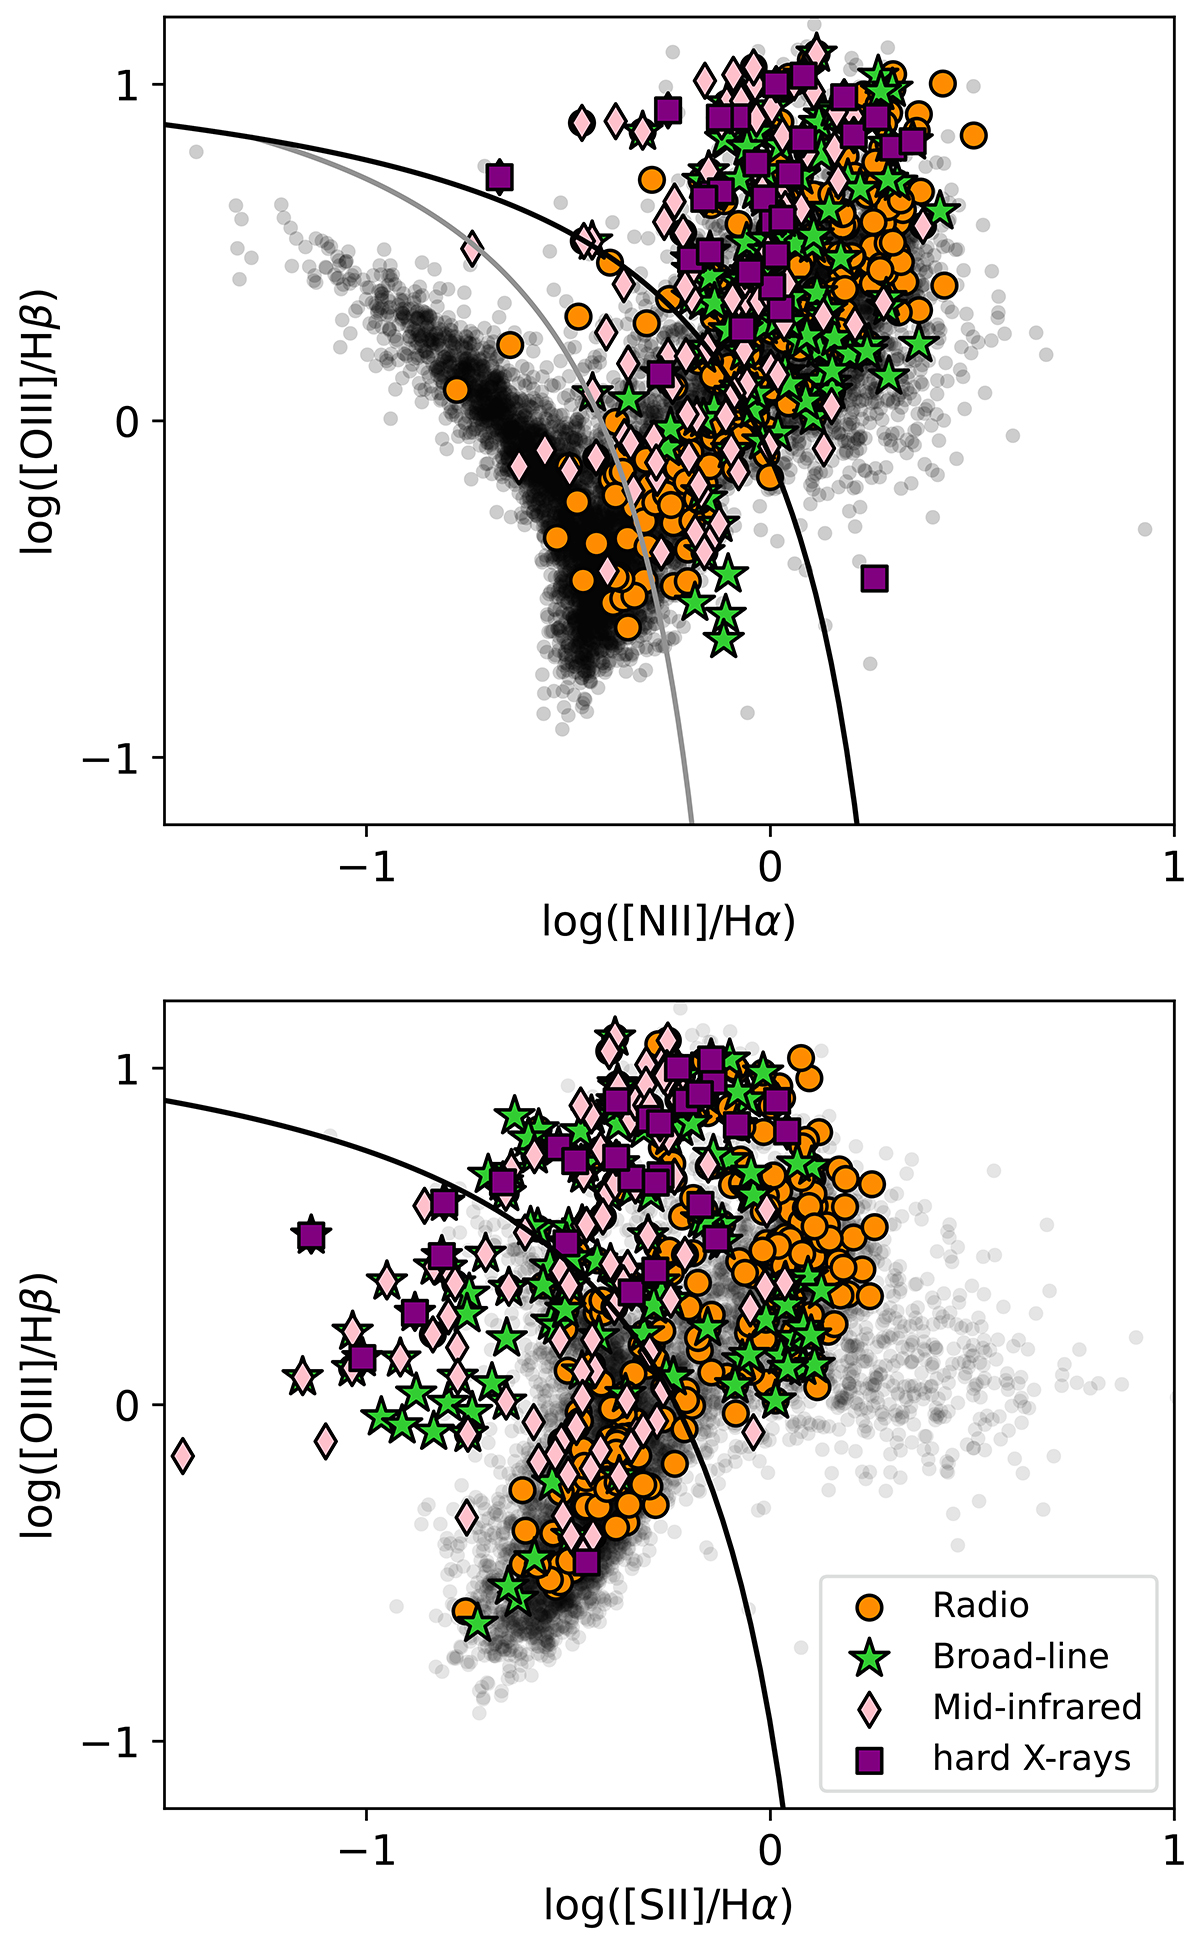
Fig. 2.
Download original image
Optical diagnostic diagrams for MaNGA galaxies. The black circles in the scatterplot show the emission-line ratio values for all MaNGA galaxies. In colored shapes, we feature the different AGN-selected candidates (see the legend). We took the flux ratio values from the ones measured around their central 2 kpc region (Albán & Wylezalek 2023). In the top panel, the gray line corresponds to the demarcation line from Kauffmann et al. (2003), and the black line (both in the top and bottom plots) corresponds to the ones from Kewley et al. (2001).
Current usage metrics show cumulative count of Article Views (full-text article views including HTML views, PDF and ePub downloads, according to the available data) and Abstracts Views on Vision4Press platform.
Data correspond to usage on the plateform after 2015. The current usage metrics is available 48-96 hours after online publication and is updated daily on week days.
Initial download of the metrics may take a while.