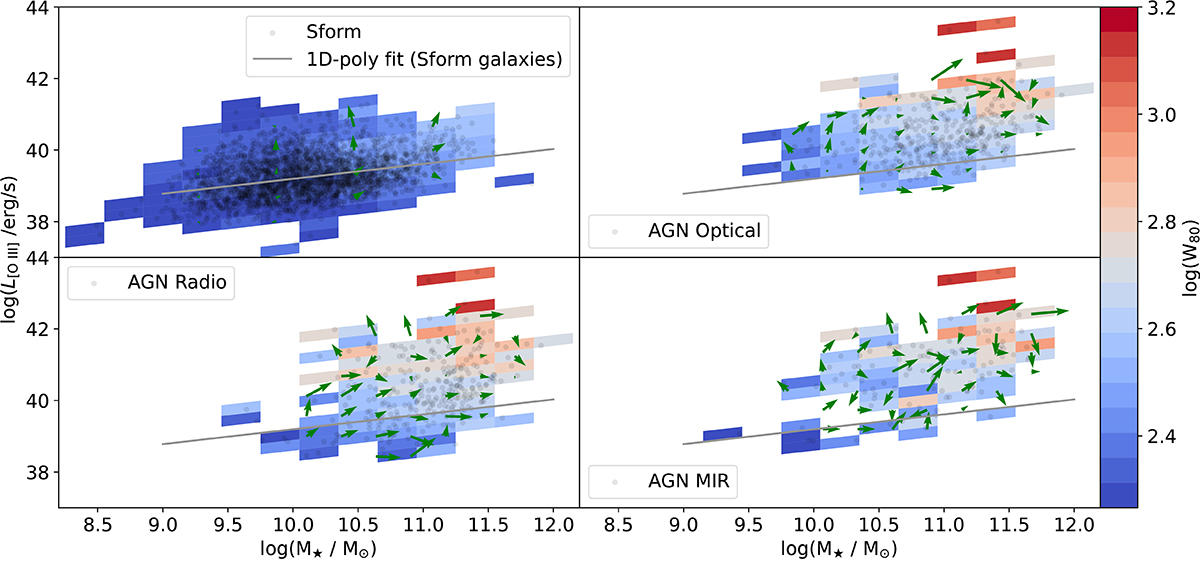
Fig. C.1.
Download original image
Average W80 binned on a plane of M⋆ vs. L[O III]. The bins have a size of 0.3 dex in each parameter, colored by the strength of the W80. The scatter dots show the distribution of a specific galaxy population and the line shows a 1D polynomial fitted to the location of the SF galaxies. The green arrows in the plots illustrate the gradient change of W80 in the parameter space, with the arrowhead indicating the direction and the arrow’s size representing the magnitude.
Current usage metrics show cumulative count of Article Views (full-text article views including HTML views, PDF and ePub downloads, according to the available data) and Abstracts Views on Vision4Press platform.
Data correspond to usage on the plateform after 2015. The current usage metrics is available 48-96 hours after online publication and is updated daily on week days.
Initial download of the metrics may take a while.