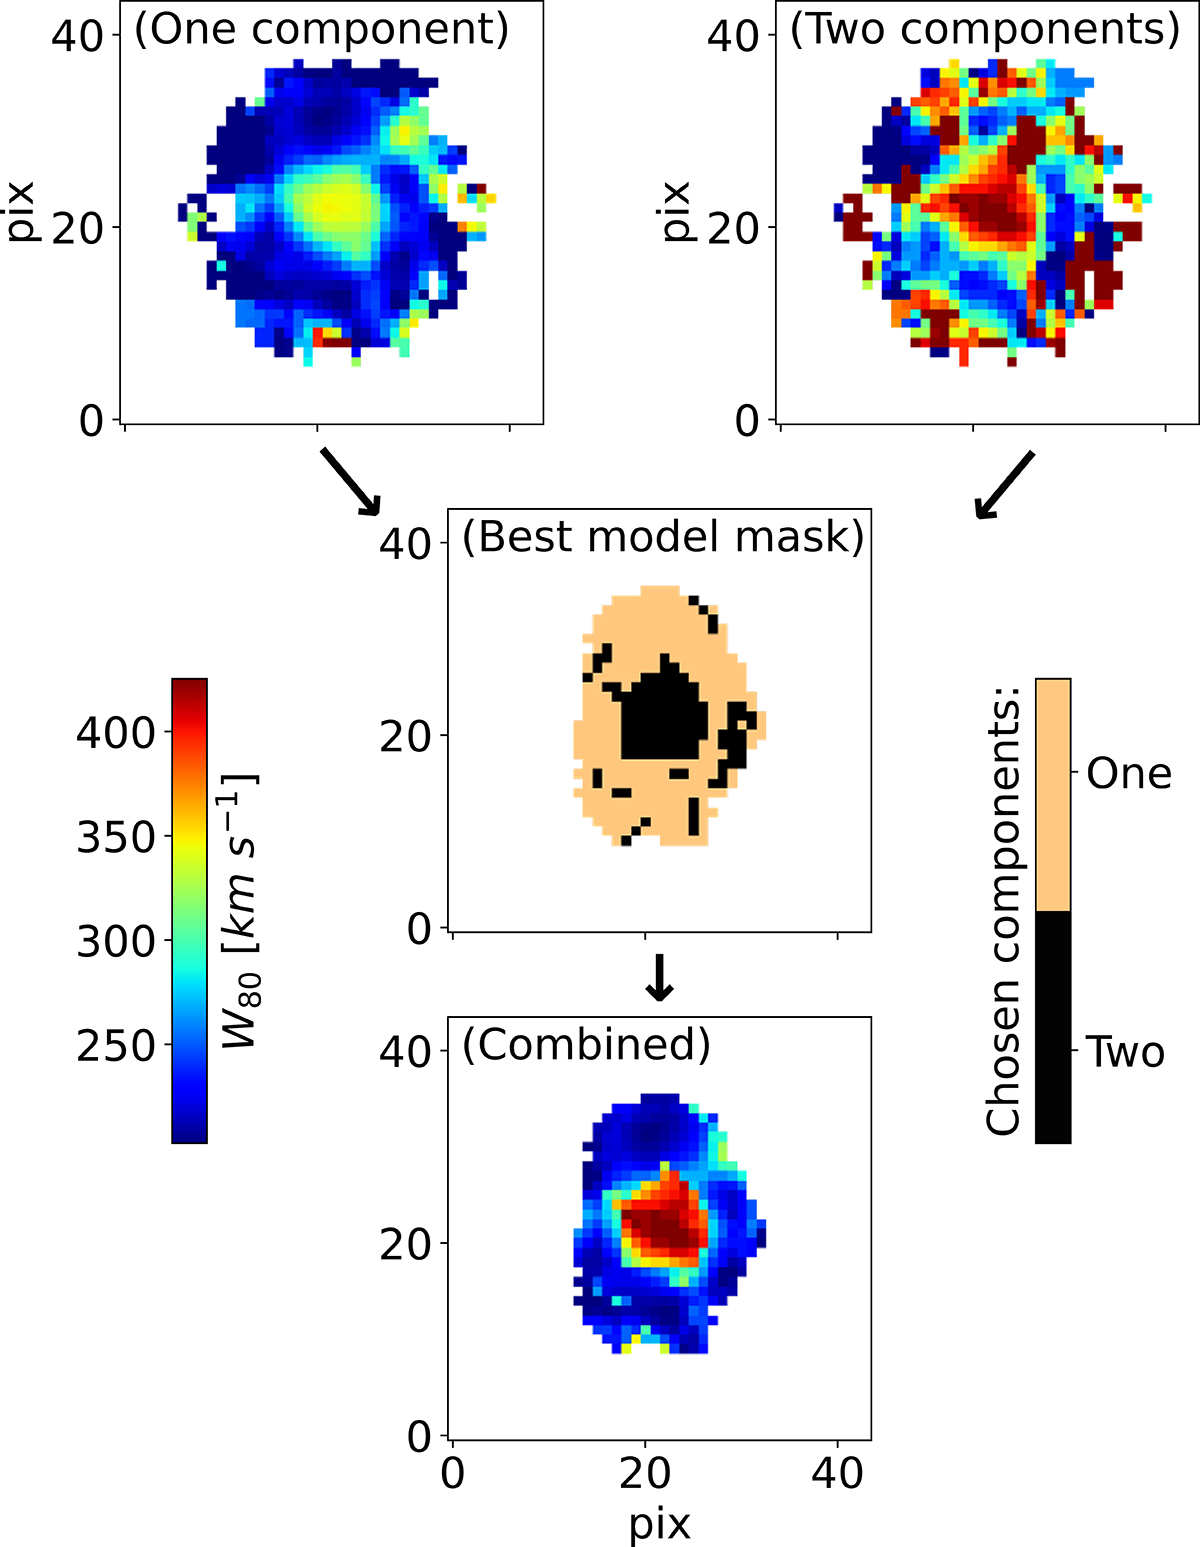
Fig. B.1.
Download original image
Output for MaNGA plate-IFU: 8244-3702. Final W80 map (bottom plot) combined from the W80 map of each model (top plots) based on the best ![]() mask (middle plot) and an additional S/N cut on the second Gaussian component (see Sect. 3.1). All these figures’ W80 maps have the same contrast colored following the same colorbar (on the middle-left).
mask (middle plot) and an additional S/N cut on the second Gaussian component (see Sect. 3.1). All these figures’ W80 maps have the same contrast colored following the same colorbar (on the middle-left).
Current usage metrics show cumulative count of Article Views (full-text article views including HTML views, PDF and ePub downloads, according to the available data) and Abstracts Views on Vision4Press platform.
Data correspond to usage on the plateform after 2015. The current usage metrics is available 48-96 hours after online publication and is updated daily on week days.
Initial download of the metrics may take a while.