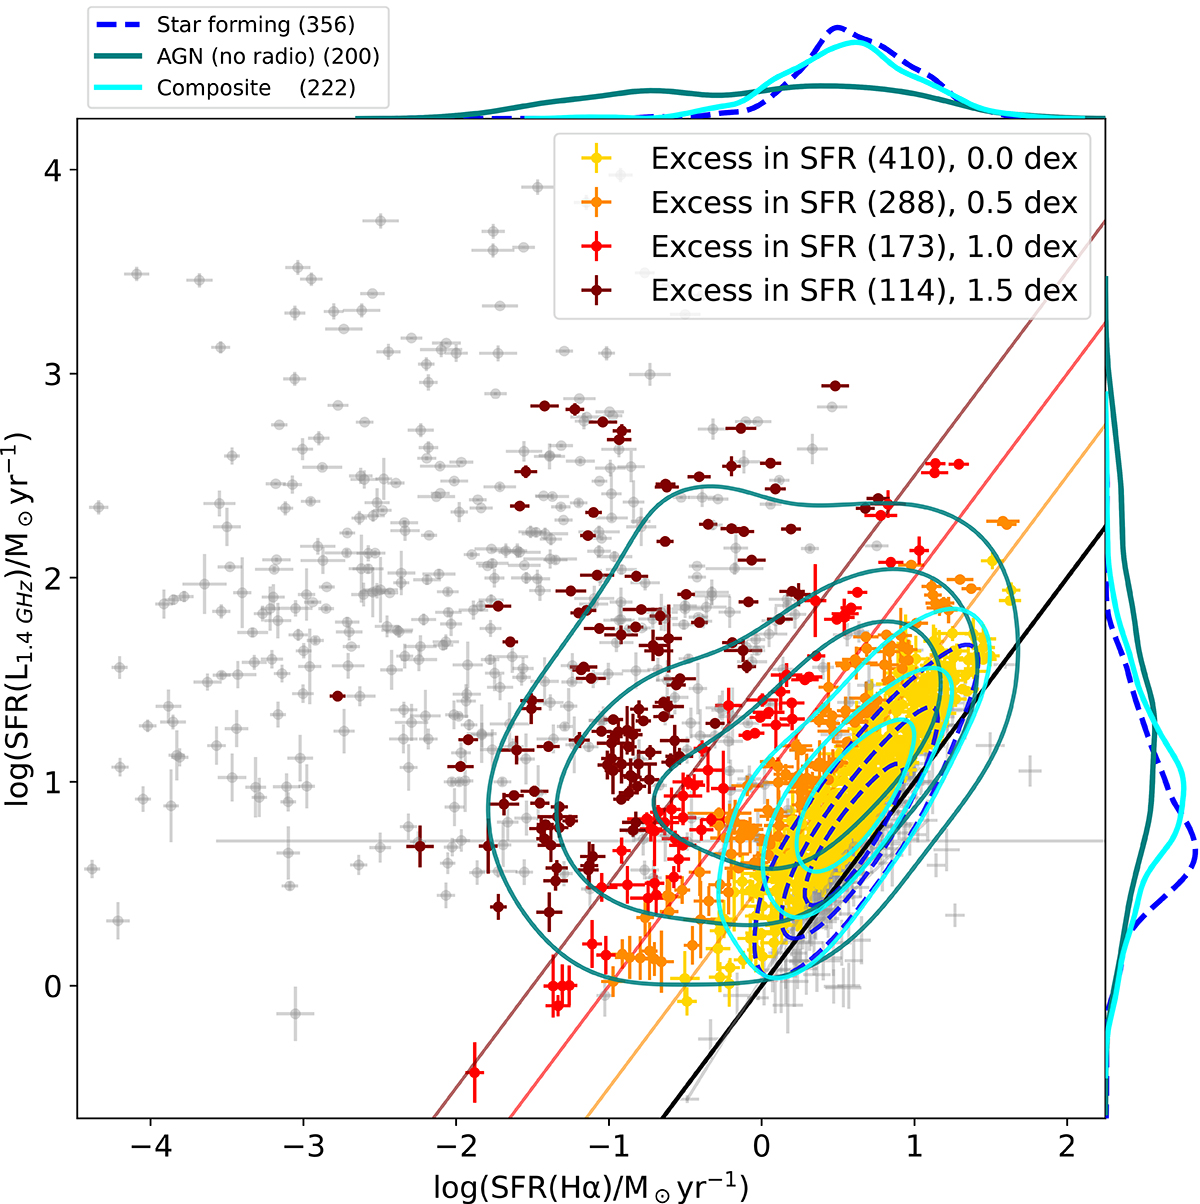
Fig. 1.
Download original image
Definition of the radio-selected AGN candidates. We plot on the y axis the expected SFR that one would measure, assuming that all the radio luminosity can be attributed to star formation processes (SFR(Lrad); see Sect. 2.2.4). Similarly, on the x axis, the SFR is expected from Hα luminosity (SFR(Hα)). The black line corresponds to the location where SFR(Lrad) = SFR(Hα). The other colored lines (orange, red, and blue) correspond to our SFR excess definition in SFR(Hα) steps of 0.5, 1.0, and 1.5 dex (log(xi)). We defined each sample of AGN-selected candidates by selecting the targets whose values (and error bars) are above the corresponding line (following SFR(Lrad)/SFR(Hα) = xi) and we have colored them according to the colored lines (except for xi = 0.0 dex, which corresponds to the yellow ones). We also show targets that did not satisfy any SFR-excess criteria (gray without marker) or did not pass the S/N criteria (gray with marker) for our kinematic analysis (see Sect. 3.2). The contours (dashed blue, light blue, and teal) represent the density where specific galaxy populations gather (SF, composite, non-radio-selected AGNs). The top and right-hand plots show the individual parameter distribution of these three galaxy populations.
Current usage metrics show cumulative count of Article Views (full-text article views including HTML views, PDF and ePub downloads, according to the available data) and Abstracts Views on Vision4Press platform.
Data correspond to usage on the plateform after 2015. The current usage metrics is available 48-96 hours after online publication and is updated daily on week days.
Initial download of the metrics may take a while.