Fig. 5.
Download original image
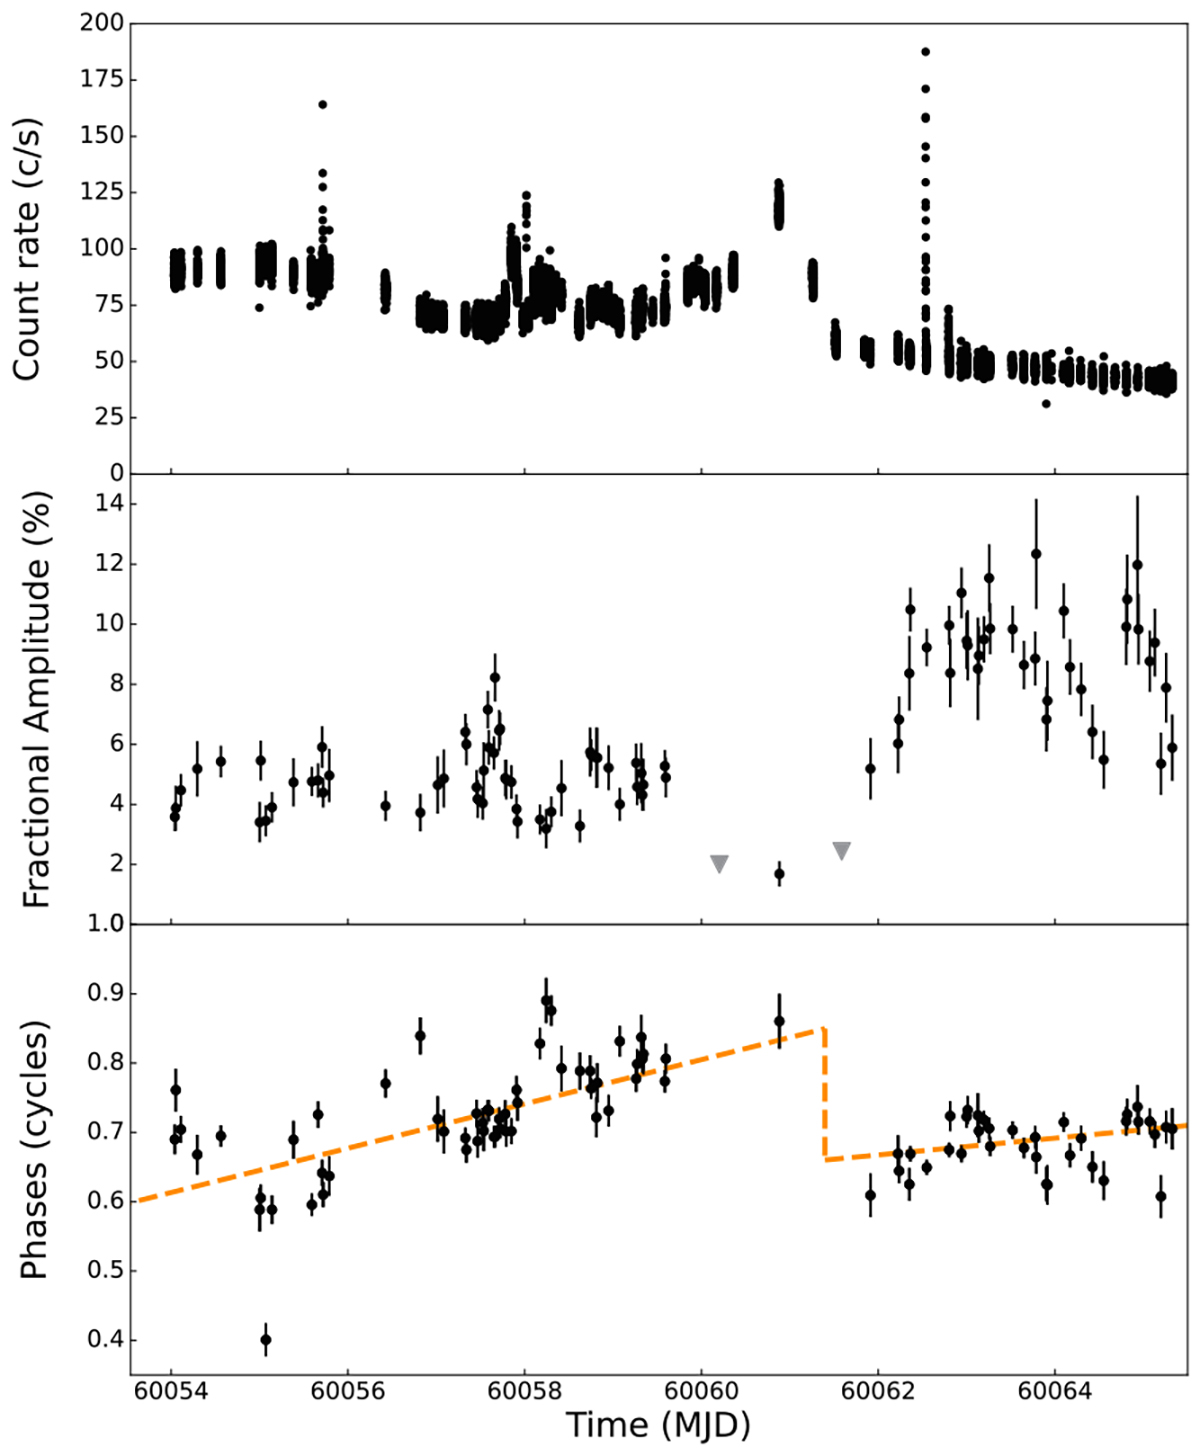
Temporal evolution of the 2023 outburst monitored with NICER. Top panel: the 0.5–10 keV light curve using 10-s bins. The type-I X-ray burst (Fig. 1) was filtered out to perform the timing analysis. Second panel: pulse fractional amplitude. Bottom panel: pulse phase. The orange dotted line represents the data modeling conducted separately for the intervals before and after the phase jump (see Table 2), along with a vertical line indicating the phase jump of ∼–0.25 cycles.
Current usage metrics show cumulative count of Article Views (full-text article views including HTML views, PDF and ePub downloads, according to the available data) and Abstracts Views on Vision4Press platform.
Data correspond to usage on the plateform after 2015. The current usage metrics is available 48-96 hours after online publication and is updated daily on week days.
Initial download of the metrics may take a while.