Fig. 8.
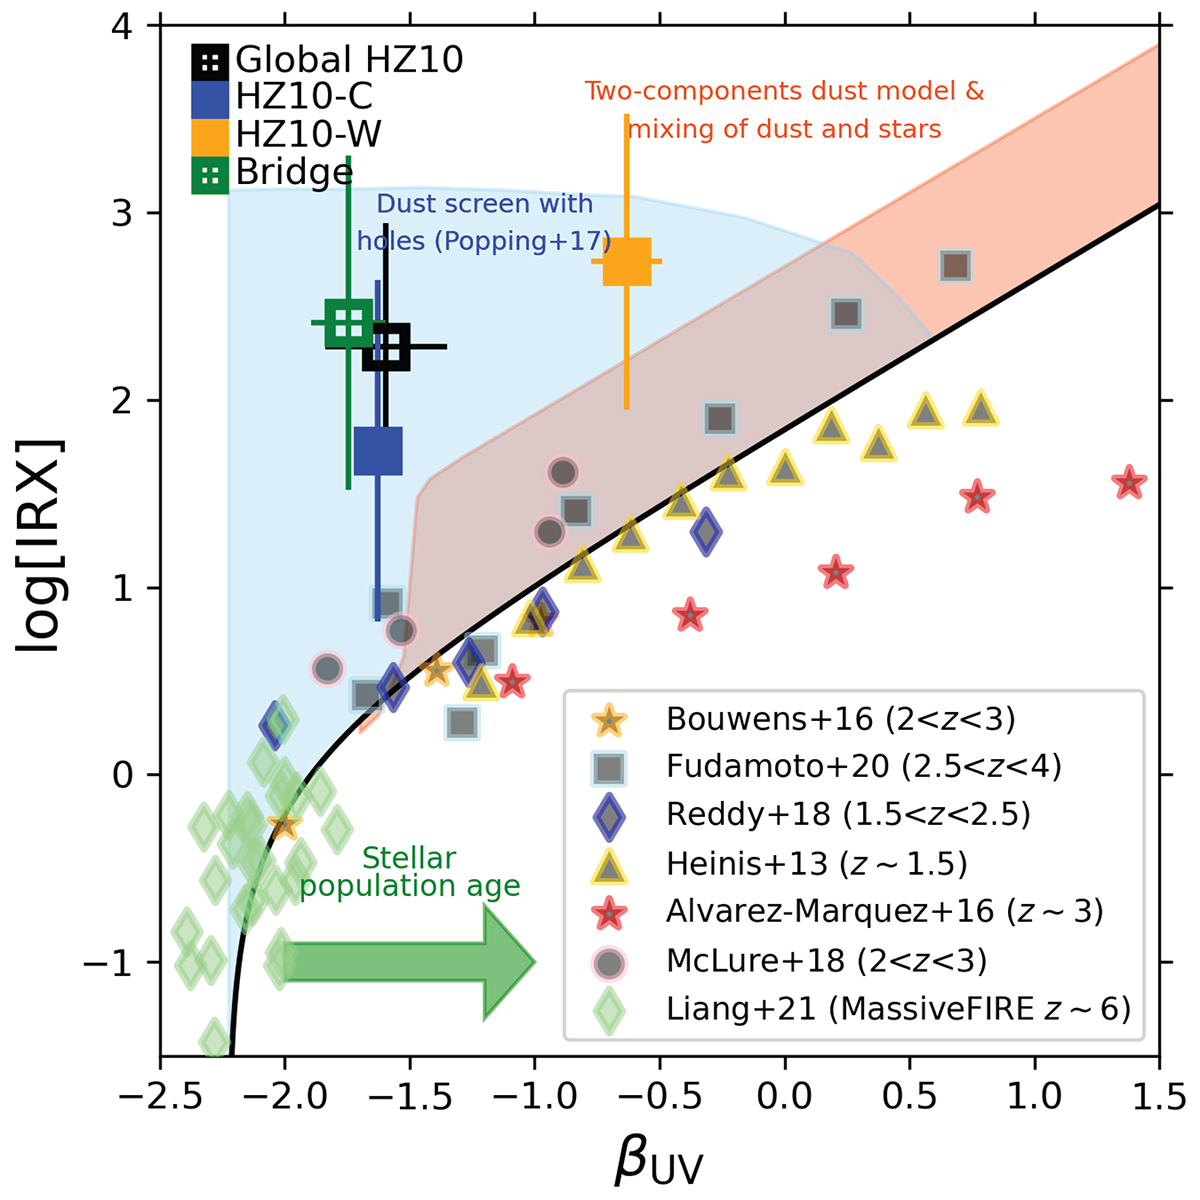
Download original image
Comparison between the IR excess (IRX) and the UV spectral slope (βUV); i.e., the IRX-βUV relation for HZ10-C, HZ10-W, and the bridge between them. The conventions are as in Fig. 7. Green diamonds correspond to the MASSIVEFIRE sample at z = 6, as included in Liang et al. (2021). The figure also encompasses a series of galaxy samples from the literature: yellow triangles are taken from Heinis et al. (2013), red stars from Álvarez-Márquez et al. (2016), orange stars from Bouwens et al. (2016), blue-edge diamonds from Reddy et al. (2018), magenta-edged circles from McLure et al. (2018), and cyan-edged squares from Fudamoto et al. (2020). The black solid line is the best linear-fit for the IRX-βUV relation for UV-selected starburst galaxies as shown in Meurer et al. (1999). The light-blue and light-orange shaded areas, as well as the green arrow at the bottom are extracted from the schematic figure included in Popping et al. (2017), which summarizes the different physical mechanisms affecting the properties of the emission sources.
Current usage metrics show cumulative count of Article Views (full-text article views including HTML views, PDF and ePub downloads, according to the available data) and Abstracts Views on Vision4Press platform.
Data correspond to usage on the plateform after 2015. The current usage metrics is available 48-96 hours after online publication and is updated daily on week days.
Initial download of the metrics may take a while.