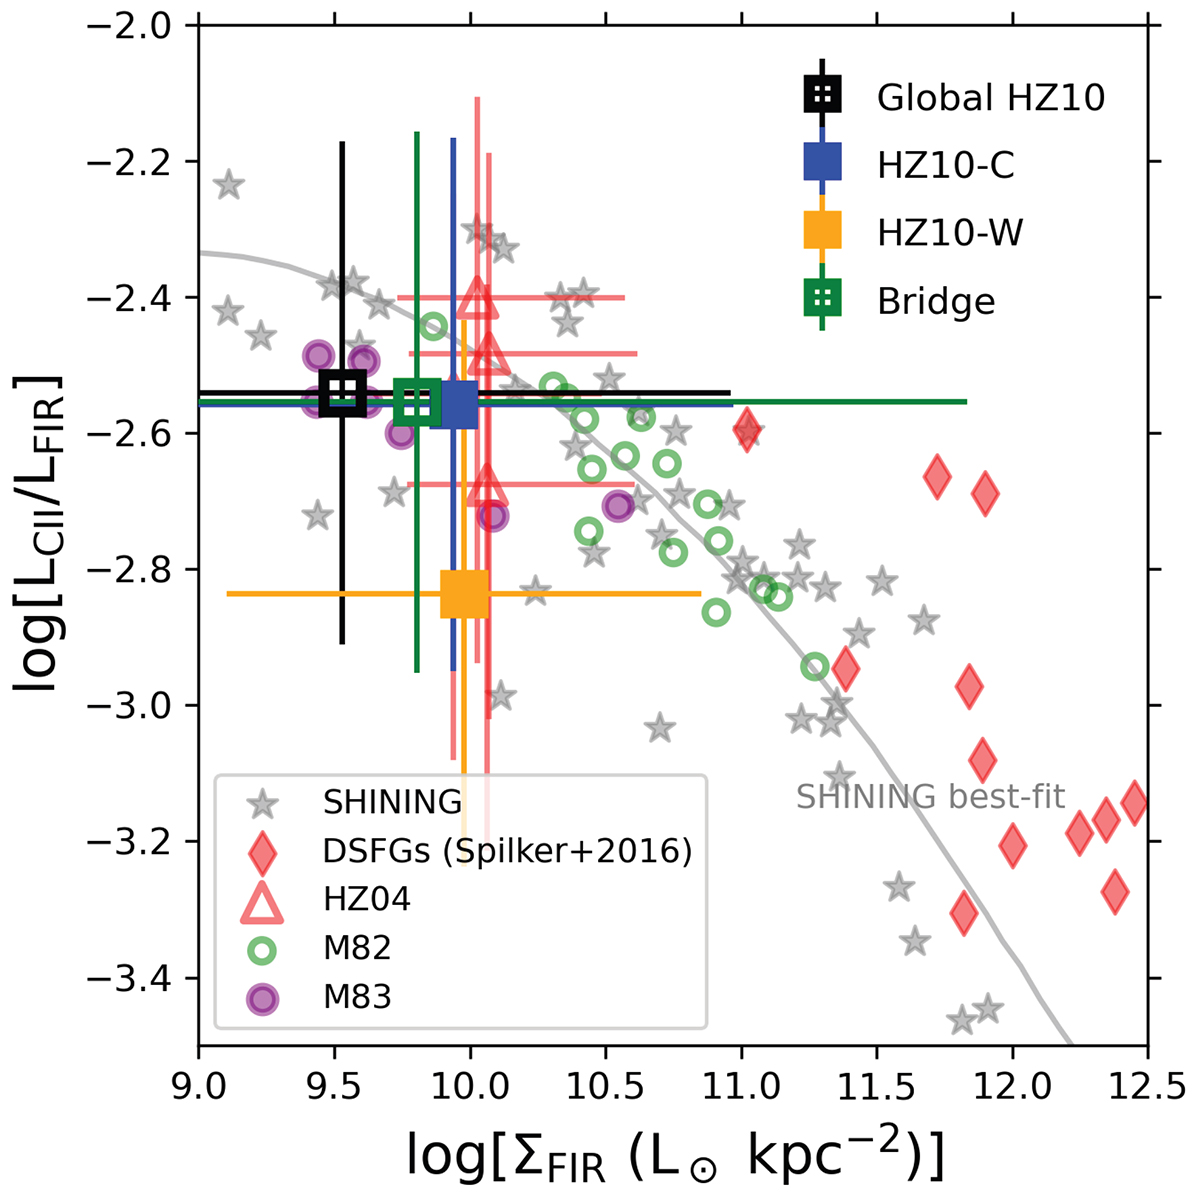
Fig. 7.
Download original image
[CII] /FIR ratio as a function of the FIR surface density (ΣFIR) for HZ10-C (blue square), HZ10-W (orange square), and the bridge between them (green empty square). For comparison, the figure also includes nearby star-forming and starburst galaxies from the SHINING sample (grey filled stars; Herrera-Camus et al. 2018a), ∼100 pc scale regions in the central disk of M82 (green unfilled dots; Contursi et al. 2013; Herrera-Camus et al. 2018a), ∼400 pc scale regions from central regions of M83 (purple filled circles), lensed dusty star-forming galaxies at z ∼ 1.9 − 5.7 (DSFGs; red-solid diamonds; Spilker et al. 2016), and four kpc-size regions extracted across the disk of HZ04 (red unfilled triangles; Herrera-Camus et al. 2021). The solid grey line corresponds to the best quadratic fit to the SHINING data (as included in Herrera-Camus et al. 2018a).
Current usage metrics show cumulative count of Article Views (full-text article views including HTML views, PDF and ePub downloads, according to the available data) and Abstracts Views on Vision4Press platform.
Data correspond to usage on the plateform after 2015. The current usage metrics is available 48-96 hours after online publication and is updated daily on week days.
Initial download of the metrics may take a while.