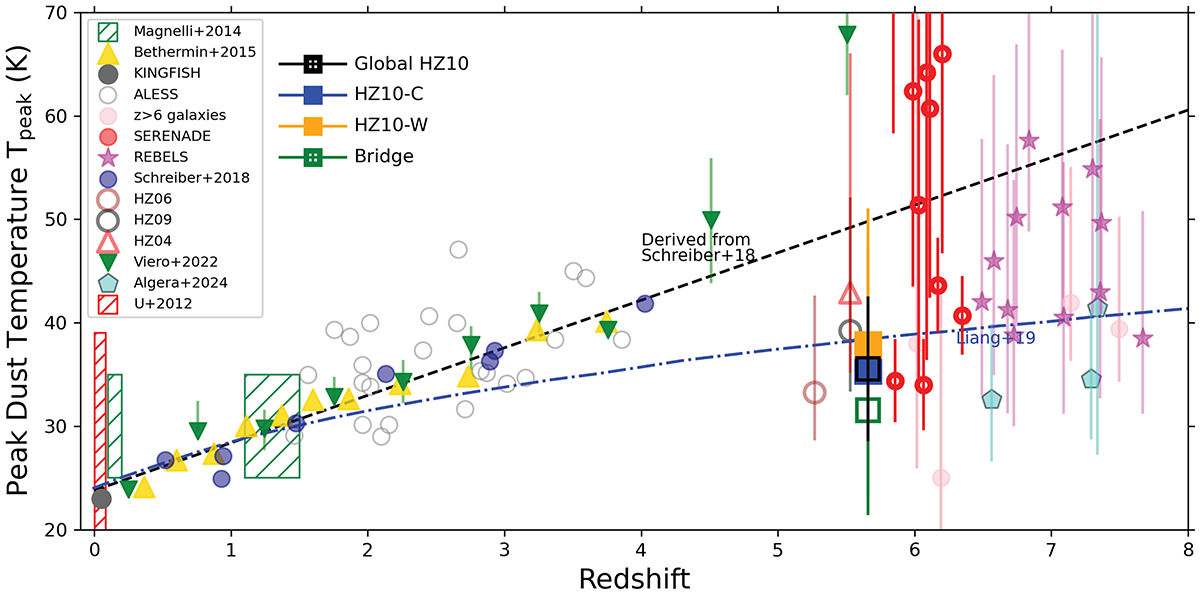
Fig. 5.
Download original image
Peak dust temperature (Tpeak) evolution with redshift for HZ10-C, HZ10-W, and the bridge as blue, orange, and green squares, respectively. The figure also includes galaxy samples at different redshift ranges: z = 0.2 − 4 (gray unfilled circles from ALESS; da Cunha et al. 2015; yellow triangles, Béthermin et al. 2015; the two latter samples are shown as included in Fig. 6 from Faisst et al. 2020), and z > 6 (purple circles; Knudsen et al. 2016; Hashimoto et al. 2019; turquoise pentagons, Algera et al. 2024). The red triangle, black circle, and brown circle are galaxies at z ∼ 5 included in Faisst et al. (2020). Magenta stars correspond to z ∼ 7 galaxies selected from the Reionization Era Bright Emission Line Survey, REBELS (Sommovigo et al. 2022). Blue large dark-blue circles correspond to galaxies from at 0.5 < z < 4 selected from the deep CANDELS fields, and the dashed-black line correspond to their linear best-fit, both extracted from Schreiber et al. (2018). Green inverted triangles correspond to results based on the stacking analysis and the expected redshift evolution from Viero et al. (2022). The blue dot-dashed line is the expected peak temperature evolution from hydrodynamic simulation (Liang et al. 2019; Ma et al. 2019). Red unfilled circles correspond to galaxies at z ≳ 6 selected from the Systematic Exploration in the Reionization Epoch using Nebular And Dust Emission (SERENADE; Harikane et al., in prep.), as included in Mitsuhashi et al. (2024a). The sample also contains three galaxies selected from Harikane et al. (2020). Finally, red and green dashed areas are correspond to the parameter space covered by galaxies selected at different redshfits from the Herschel Multi-tiered Extragalactic Survey (HerMES; Magnelli et al. 2014) and ultraluminous infrared galaxies selected from the Great Observatories All-sky LIRG Survey (GOALS; U et al. 2012), respectively.
Current usage metrics show cumulative count of Article Views (full-text article views including HTML views, PDF and ePub downloads, according to the available data) and Abstracts Views on Vision4Press platform.
Data correspond to usage on the plateform after 2015. The current usage metrics is available 48-96 hours after online publication and is updated daily on week days.
Initial download of the metrics may take a while.