Fig. 4.
Download original image
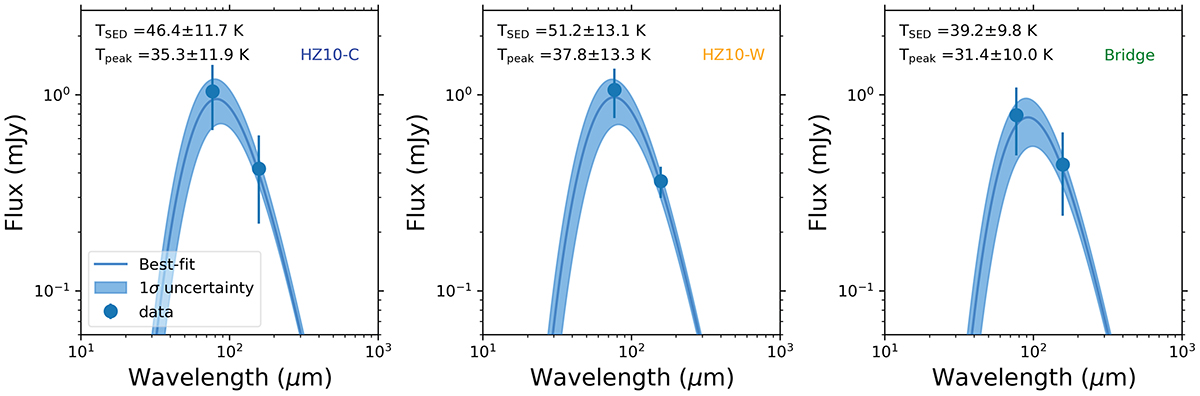
Best-fitting results for FIR SEDs for 77 and 158 μm continuum emission, using Eqs. (2)–(3) and adopting the βd obtained in Fig. 3, for the three components identified in the analysis from Sect. 4.1: HZ10-C (left panel), HZ10-W (middle panel), and the bridge (right panel). Conventions are the same as in Fig. 3. As shown in Figs. 1 and 2, HZ10-C and the bridge have lower 77 μm continuum emission, compared to that for HZ10-W (although still within the uncertainties); this may be reflecting a strong UV dust absorption in HZ10-W, which translates into a higher TSED temperature when compared to those of the other two components (although all of them with the same temperature within 1σ).
Current usage metrics show cumulative count of Article Views (full-text article views including HTML views, PDF and ePub downloads, according to the available data) and Abstracts Views on Vision4Press platform.
Data correspond to usage on the plateform after 2015. The current usage metrics is available 48-96 hours after online publication and is updated daily on week days.
Initial download of the metrics may take a while.