Fig. 2.
Download original image
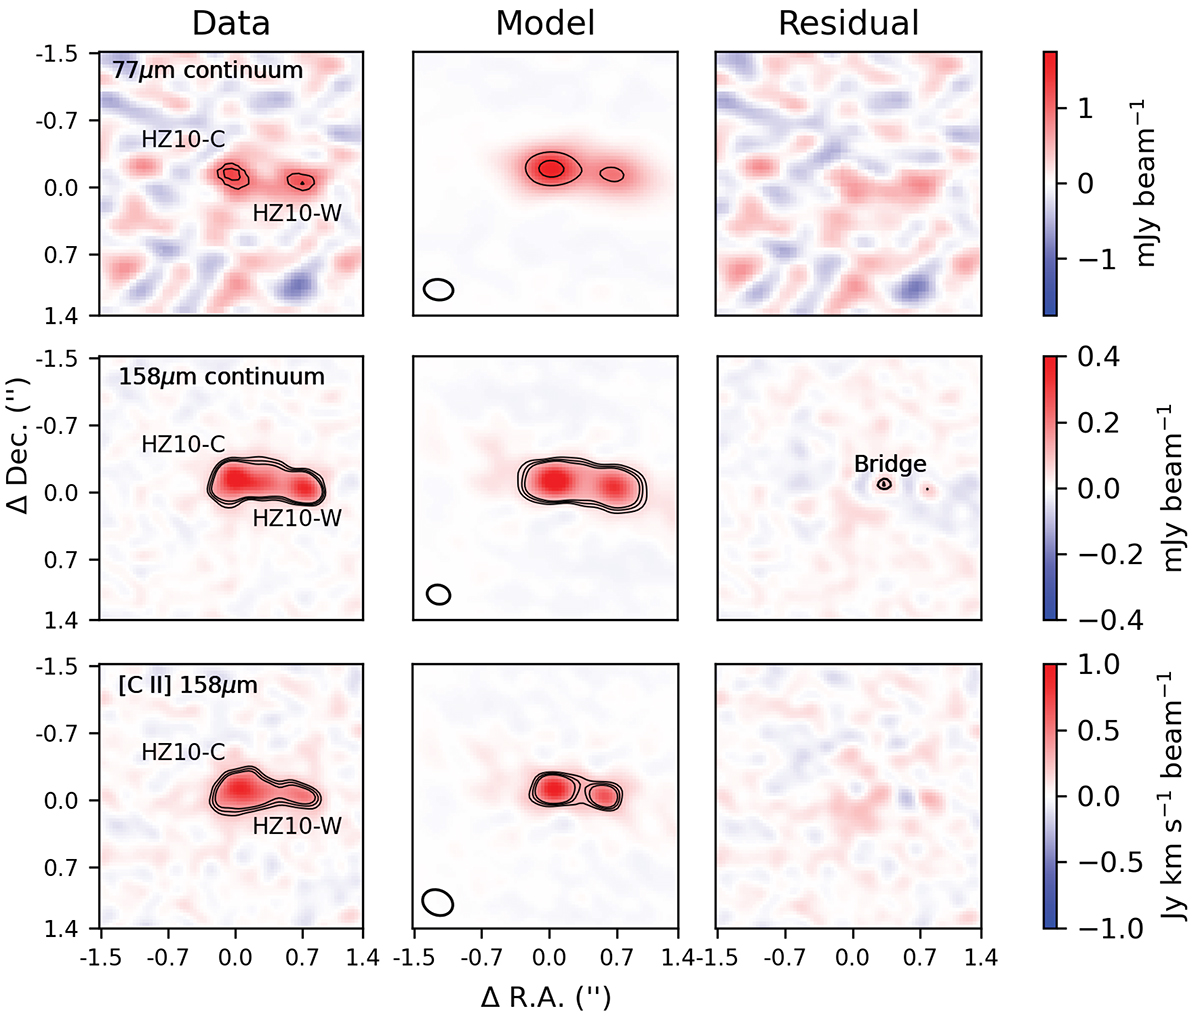
Results from the parametric 2D modeling of HZ10 using PYAUTOGALAXY, in panels of 3′′ × 3′′. While the left panels contain the observed emission (colormap and black-solid contours), the middle and right panels show the best model using 2D Sérsic profiles (see Table 2 for more details) and the residuals after subtracting the maximum likelihood model, respectively. From top to bottom, panels contain the rest-frame 77 μm ALMA continuum (top row), 158 μm ALMA continuum (middle row), and [CII] 158 μm line emission (top row). The beam sizes of the data are represented by ellipses at the bottom-left of middle panels. For all the subplots, the contour are the [0 (dashed), 4σ, 5σ, and 6σ] levels. The figure confirms the binary nature of HZ10, which can be decomposed in HZ10-C (at the center), HZ10-W (to the left), and the bridge between the two main components (with at least a 5σ significance on the residual 158 μm continuum map). The latter seems to reflect the extended dusty component connecting HZ10-C and HZ10-W.
Current usage metrics show cumulative count of Article Views (full-text article views including HTML views, PDF and ePub downloads, according to the available data) and Abstracts Views on Vision4Press platform.
Data correspond to usage on the plateform after 2015. The current usage metrics is available 48-96 hours after online publication and is updated daily on week days.
Initial download of the metrics may take a while.