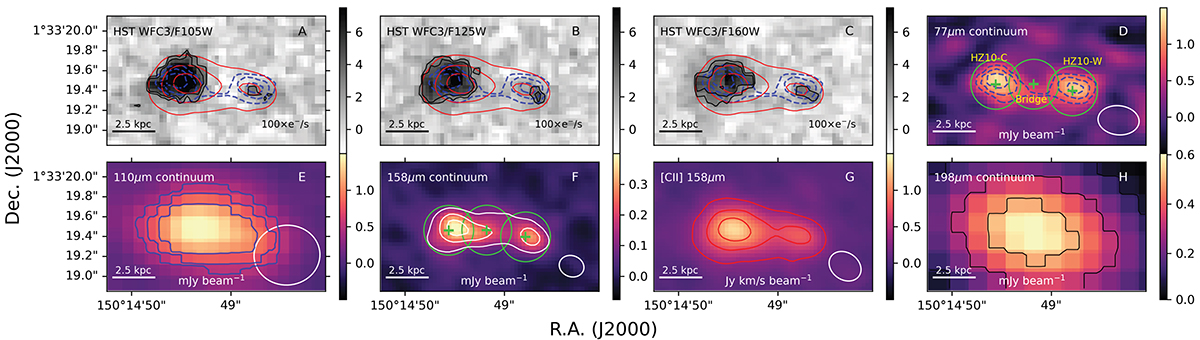
Fig. 1.
Download original image
HZ10 HST, ALMA Band 9, 8, and 7, [CII], and Band 6 morphologies in cutouts of 1.3′′ × 2.2′′. Panels A, B, and C contain the WFC3 F105W, F125W, and F160W images, respectively, in grey scale. The black contours in the three panels are the [0.9, 1.2, 2.1] × 10−21 erg s−1 cm−2 Å−1 levels of the F105W, F125W, and F160W filters. The blue-dashed and red-solid contours correspond to [3σ, 4σ, 5σ] and [6σ, 12σ, 18σ] levels for the 77 μm continuum and [CII] integrated intensity, respectively. From D to H: Panels include the 77 μm ALMA continuum, 110 μm ALMA continuum, 158 μm ALMA continuum, and 158 μm [CII], and 198 μm ALMA continuum images, respectively. Contours levels in panels D and G are the same as in panel A, B, and C, for 77 μm continuum, and [CII] integrated intensity, respectively. While blue-solid contours in panels E and H [3σ, 4σ, 5σ] levels for 110 μm and 198 μm ALMA continuum maps, respectively, the white-solid contours in panel G are the [6σ, 4σ, 5σ] levels for the 158 μm ALMA continuum maps. Finally, while green crosses in panel B are the centers of the Seérsic profiles computed for the three sources (e.g., HZ10-C, HZ10-W, and “the bridge”) analysed in this work (see Sect. 3.2), the green circles correspond to the apertures used to perform the angular resolved analysis (see Sect. 4.2 for more details).
Current usage metrics show cumulative count of Article Views (full-text article views including HTML views, PDF and ePub downloads, according to the available data) and Abstracts Views on Vision4Press platform.
Data correspond to usage on the plateform after 2015. The current usage metrics is available 48-96 hours after online publication and is updated daily on week days.
Initial download of the metrics may take a while.