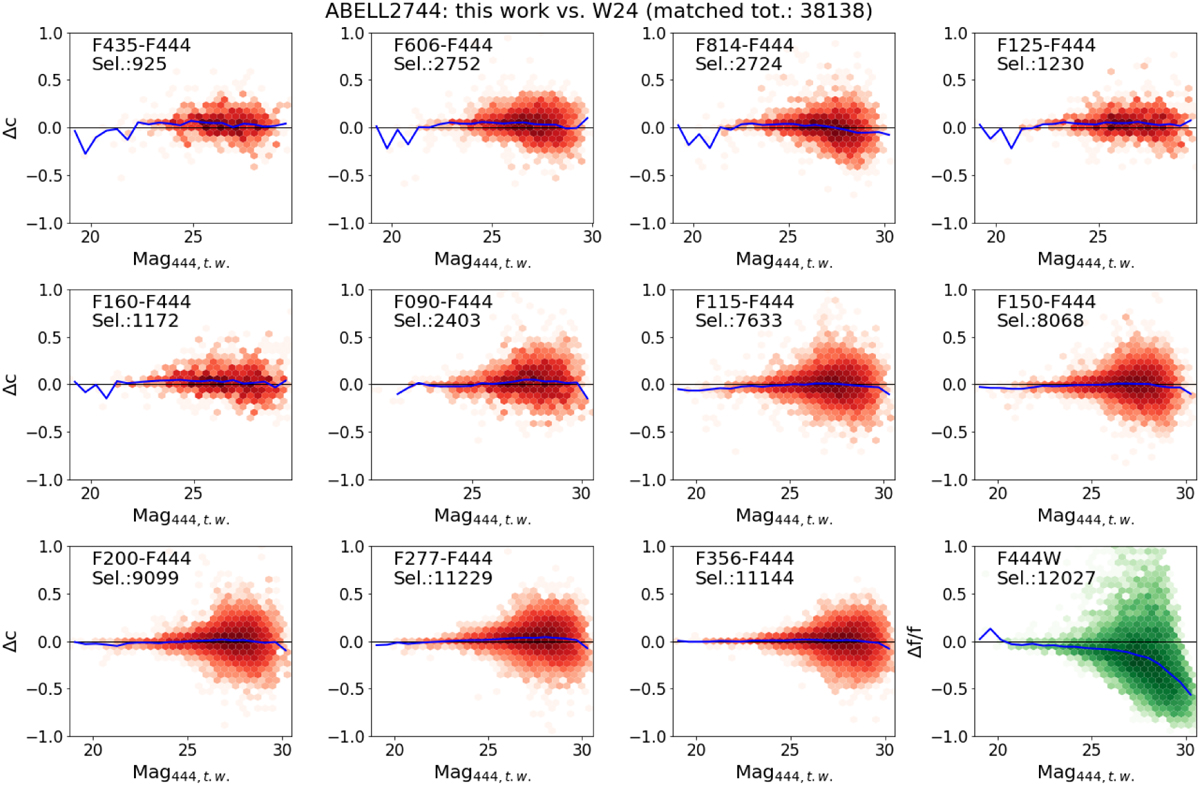
Fig. 9
Download original image
Example of a photometry validation plot, comparing the catalogues for the ABELL2744 field from this work and from Weaver et al. (2024). Relative errors, Δc, are given, namely, the colours measured in this work minus those in the reference catalogues), versus the second band magnitude in this work catalogue (e.g. F444W for the F356-F444W colour). The number of cross-matched sources after excluding those with S/N <5 in any of the two catalogues or flag ≥200 in this work is also given; the blue line is the median of the distribution. Similar plots for all fields are available in the appendix.
Current usage metrics show cumulative count of Article Views (full-text article views including HTML views, PDF and ePub downloads, according to the available data) and Abstracts Views on Vision4Press platform.
Data correspond to usage on the plateform after 2015. The current usage metrics is available 48-96 hours after online publication and is updated daily on week days.
Initial download of the metrics may take a while.