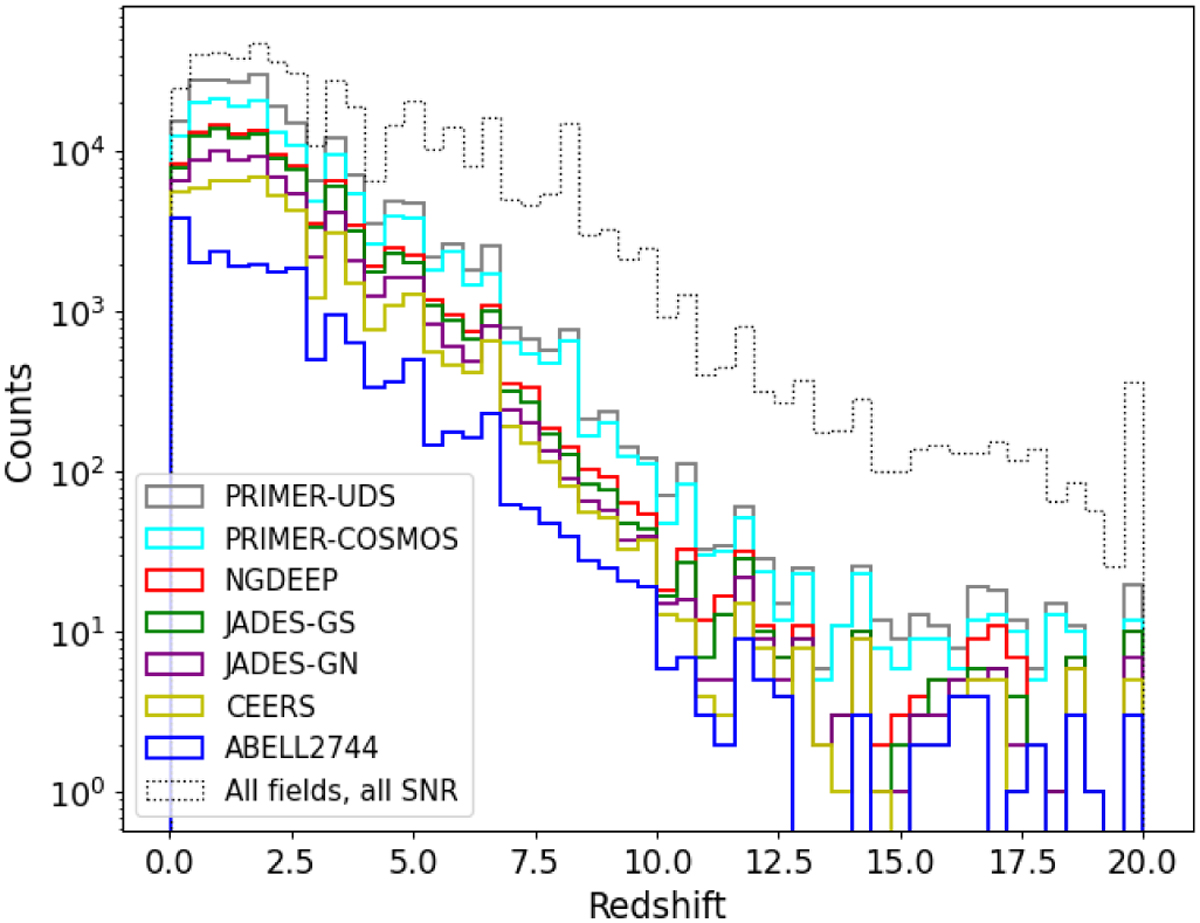
Fig. 12
Download original image
Distribution of the median photometric redshifts obtained with the runs described in Sect. 5 (raw counts per redshift bin, Δz=0.4). Stacked coloured histograms refer to individual fields, showing only sources with S/NF356W+F444W > 10 and flag <400. The dotted black line shows the cumulative distribution for all fields, including all S/N.
Current usage metrics show cumulative count of Article Views (full-text article views including HTML views, PDF and ePub downloads, according to the available data) and Abstracts Views on Vision4Press platform.
Data correspond to usage on the plateform after 2015. The current usage metrics is available 48-96 hours after online publication and is updated daily on week days.
Initial download of the metrics may take a while.