Open Access
Fig. 9
Download original image
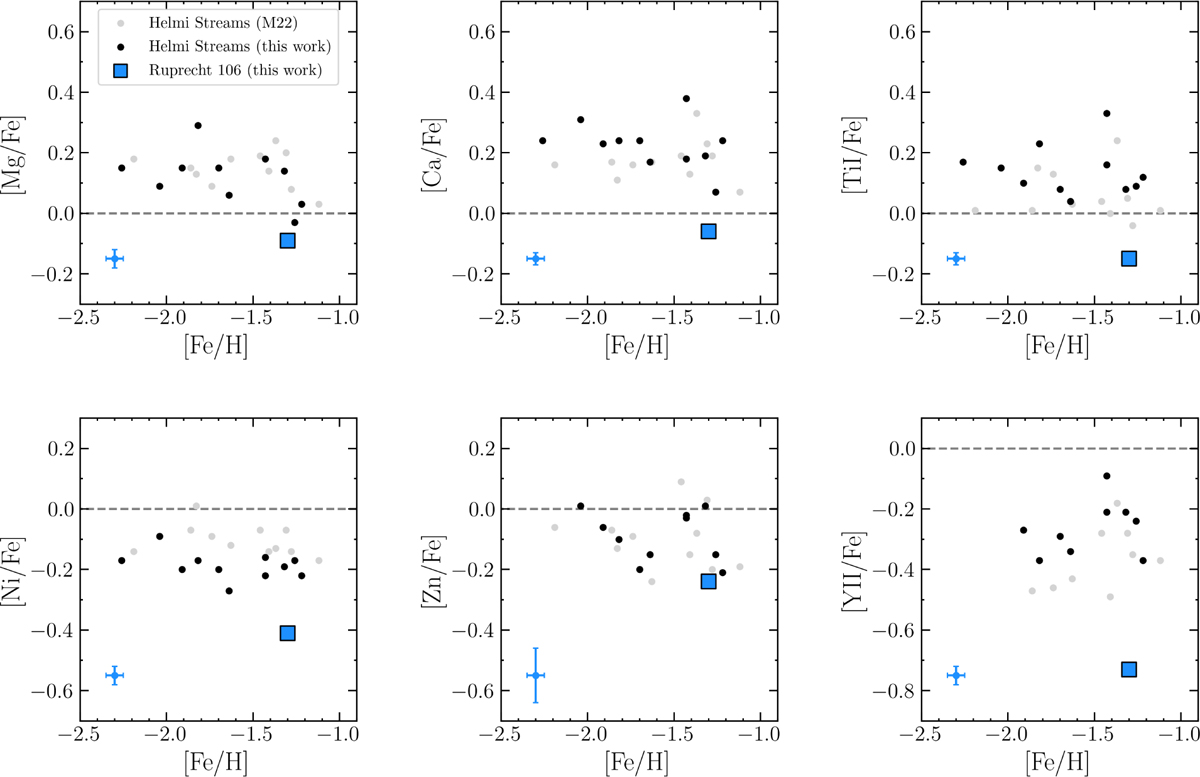
Mean abundances of Rup106 derived in this work (blue filled squares) compared with those derived for field stars associated with the Helmi Streams (results from this work and from M22 are shown in black and grey, respectively). We plot the standard deviation in the bottom left corner.
Current usage metrics show cumulative count of Article Views (full-text article views including HTML views, PDF and ePub downloads, according to the available data) and Abstracts Views on Vision4Press platform.
Data correspond to usage on the plateform after 2015. The current usage metrics is available 48-96 hours after online publication and is updated daily on week days.
Initial download of the metrics may take a while.