Open Access
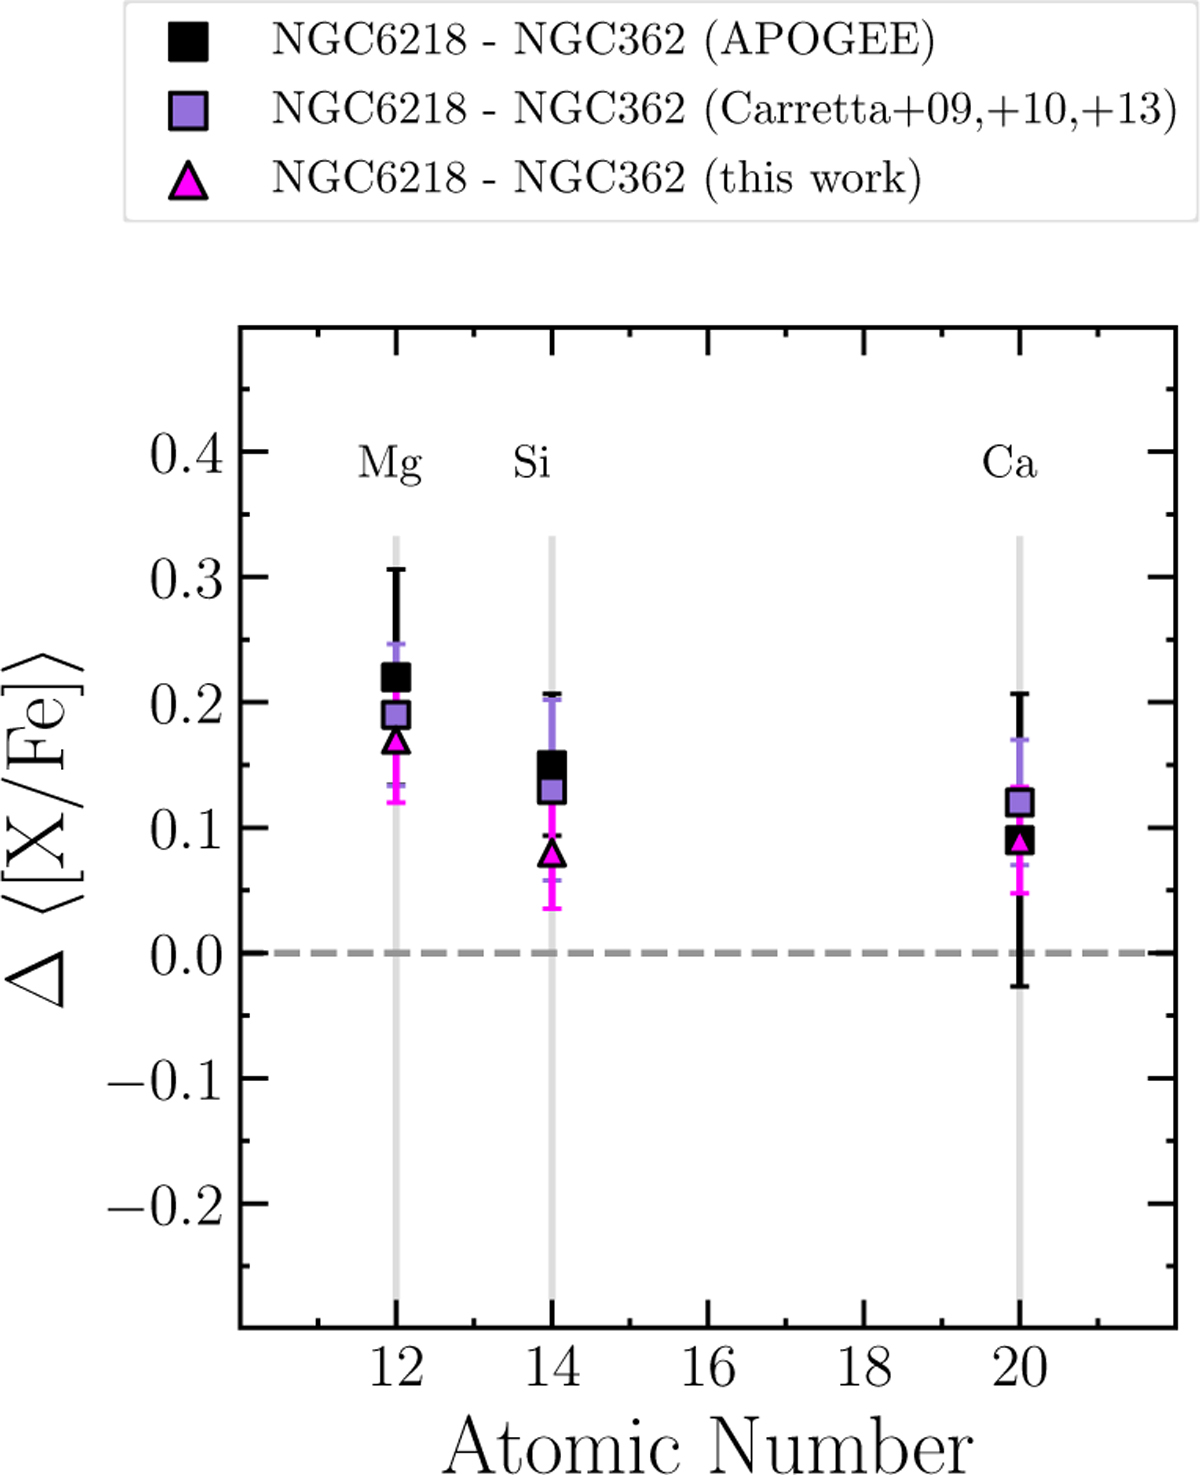
Fig. A.1
Download original image
Difference of mean abundance ratios of the α-elements [Mg/Fe], [Si/Fe], and [Ca/Fe] between NGC 6218 and NGC 362 from this work (pink triangles), Carretta et al. (2009, 2010, 2013) (purple squares), and APOGEE (black squares). Error bars indicate the standard deviation.
Current usage metrics show cumulative count of Article Views (full-text article views including HTML views, PDF and ePub downloads, according to the available data) and Abstracts Views on Vision4Press platform.
Data correspond to usage on the plateform after 2015. The current usage metrics is available 48-96 hours after online publication and is updated daily on week days.
Initial download of the metrics may take a while.