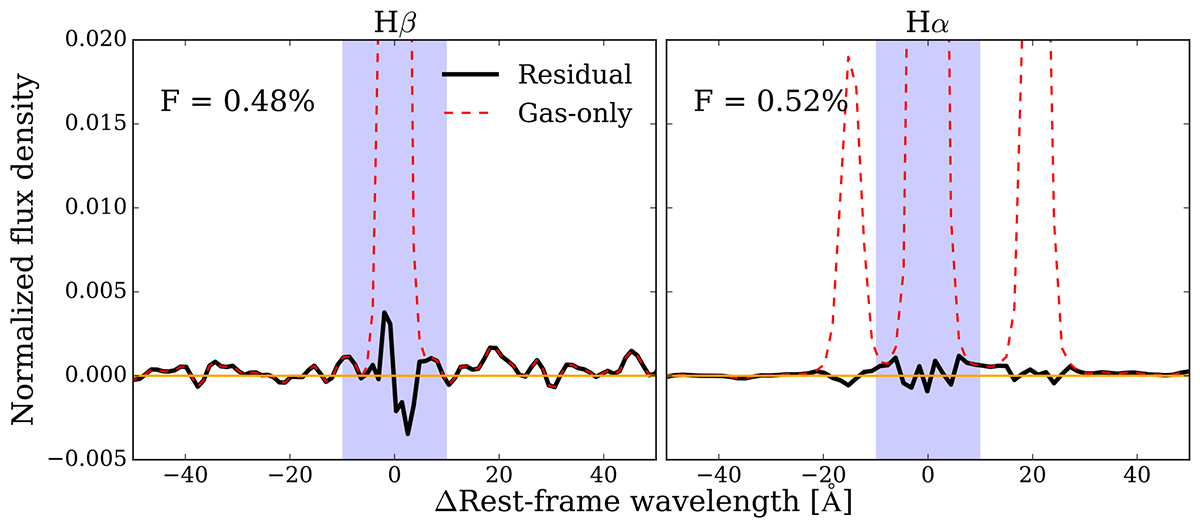
Fig. A.1.
Download original image
Stacked residual spectra normalized by emission-line flux for Hβ (left) and Hα (right). The black solid curves are the normalized residual spectra, while the red dashed curves are the normalized gas-only (i.e., stellar-continuum subtracted) spectra for reference. The orange horizontal lines denote where the flux is zero. The F values (upper-left corners) indicate the fraction of integrated residual flux compared to the emission line flux, measured within the blue-shaded region of 20 Å width.
Current usage metrics show cumulative count of Article Views (full-text article views including HTML views, PDF and ePub downloads, according to the available data) and Abstracts Views on Vision4Press platform.
Data correspond to usage on the plateform after 2015. The current usage metrics is available 48-96 hours after online publication and is updated daily on week days.
Initial download of the metrics may take a while.