Fig. 7.
Download original image
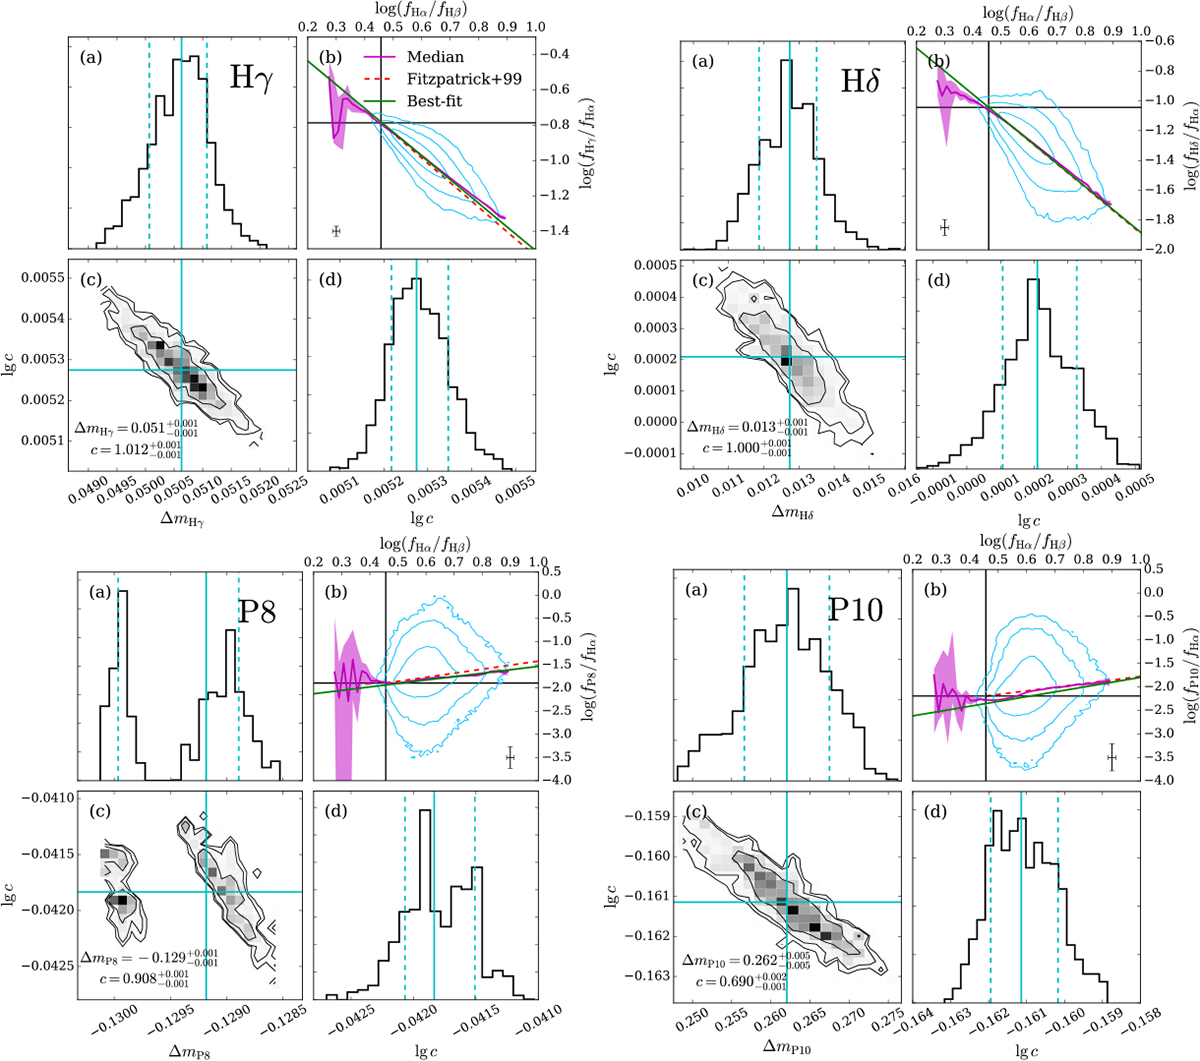
Best-fit results for the four main recombination lines derived from the minimization-MCMC fitting method. In each case, Panel (c) shows the posterior probability distribution of the two parameters, while Panels (a) and (d) are the marginalized distributions of individual parameters. The cyan solid lines in these panels locate the medians of the corresponding distributions, and the cyan dashed lines enclose the 16th-84th percentile ranges of the distributions. The fit-best results with 1σ uncertainties (i.e., the 16th-84th percentile ranges) for ΔmX and c are listed in Panel (c). Panel (b) gives the comparison between the best-fit relation (green line) and the observed median curve (magenta curve) on the line ratio plane. Other symbols are similar to those in Fig. 2 but for the ΣSFR, cor-selected sample.
Current usage metrics show cumulative count of Article Views (full-text article views including HTML views, PDF and ePub downloads, according to the available data) and Abstracts Views on Vision4Press platform.
Data correspond to usage on the plateform after 2015. The current usage metrics is available 48-96 hours after online publication and is updated daily on week days.
Initial download of the metrics may take a while.