Fig. 5.
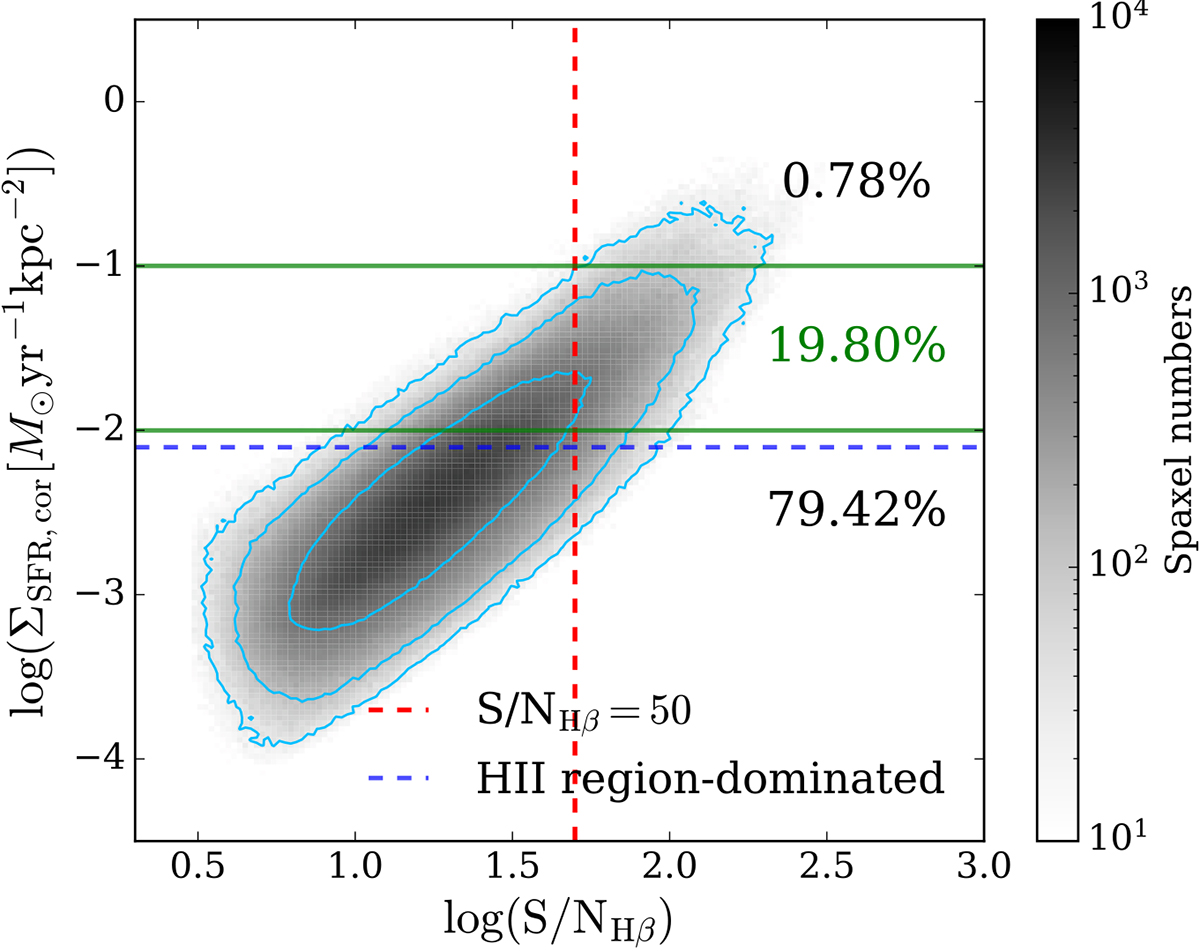
Download original image
S/N of Hβ as a function of the corrected SFR surface density. The vertical red dashed line indicates S/NHβ = 50, while the blue dashed line is the selection criterion of H II region-dominated spaxels for the MaNGA survey proposed by Zhang et al. (2017). The two green horizontal lines locate ΣSFR, cor = 0.01 and 0.1 M⊙yr−1kpc−2, respectively. The three percentages suggest the fractions of spaxels within each ΣSFR, cor bin. Spaxels between the green lines are adopted as the subsample to fit the slopes of the nebular dust attenuation curve. The underlying gray map and cyan contours are the same as those in Fig. 1.
Current usage metrics show cumulative count of Article Views (full-text article views including HTML views, PDF and ePub downloads, according to the available data) and Abstracts Views on Vision4Press platform.
Data correspond to usage on the plateform after 2015. The current usage metrics is available 48-96 hours after online publication and is updated daily on week days.
Initial download of the metrics may take a while.