Fig. 4.
Download original image
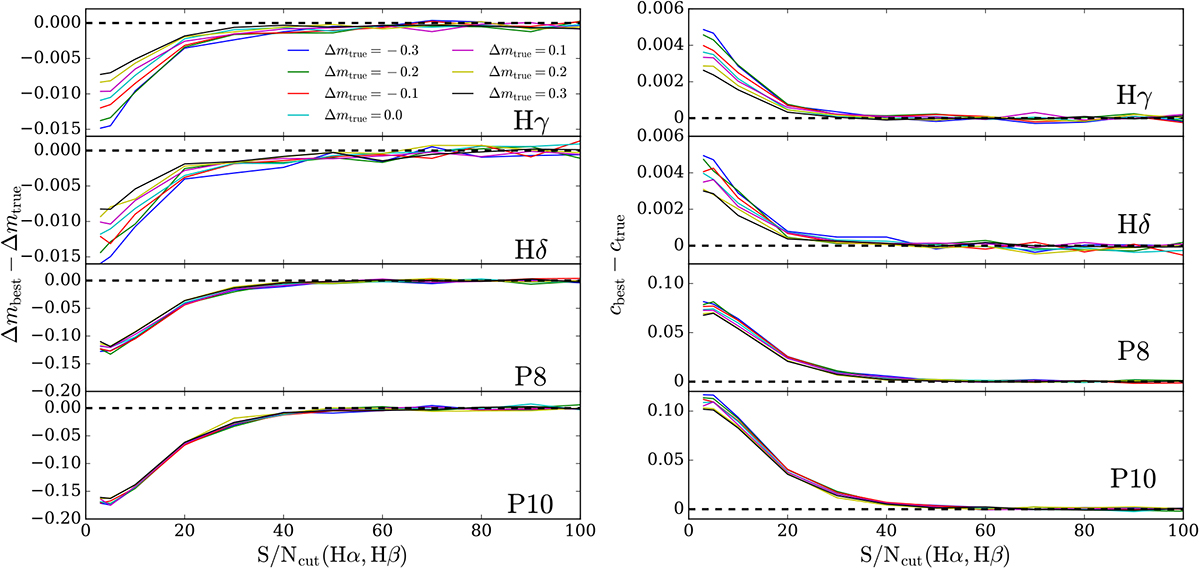
Differences between the recovered and true values of the free parameters Δm (left) and c (right) as a function of the adopted Hα and Hβ S/N thresholds ranging from 3 to 100. Results based on the simulated catalogs with different true Δm are delineated by different colors. The fitting procedure to derive the best-fit parameters only includes the minimize step for saving computing resources.
Current usage metrics show cumulative count of Article Views (full-text article views including HTML views, PDF and ePub downloads, according to the available data) and Abstracts Views on Vision4Press platform.
Data correspond to usage on the plateform after 2015. The current usage metrics is available 48-96 hours after online publication and is updated daily on week days.
Initial download of the metrics may take a while.