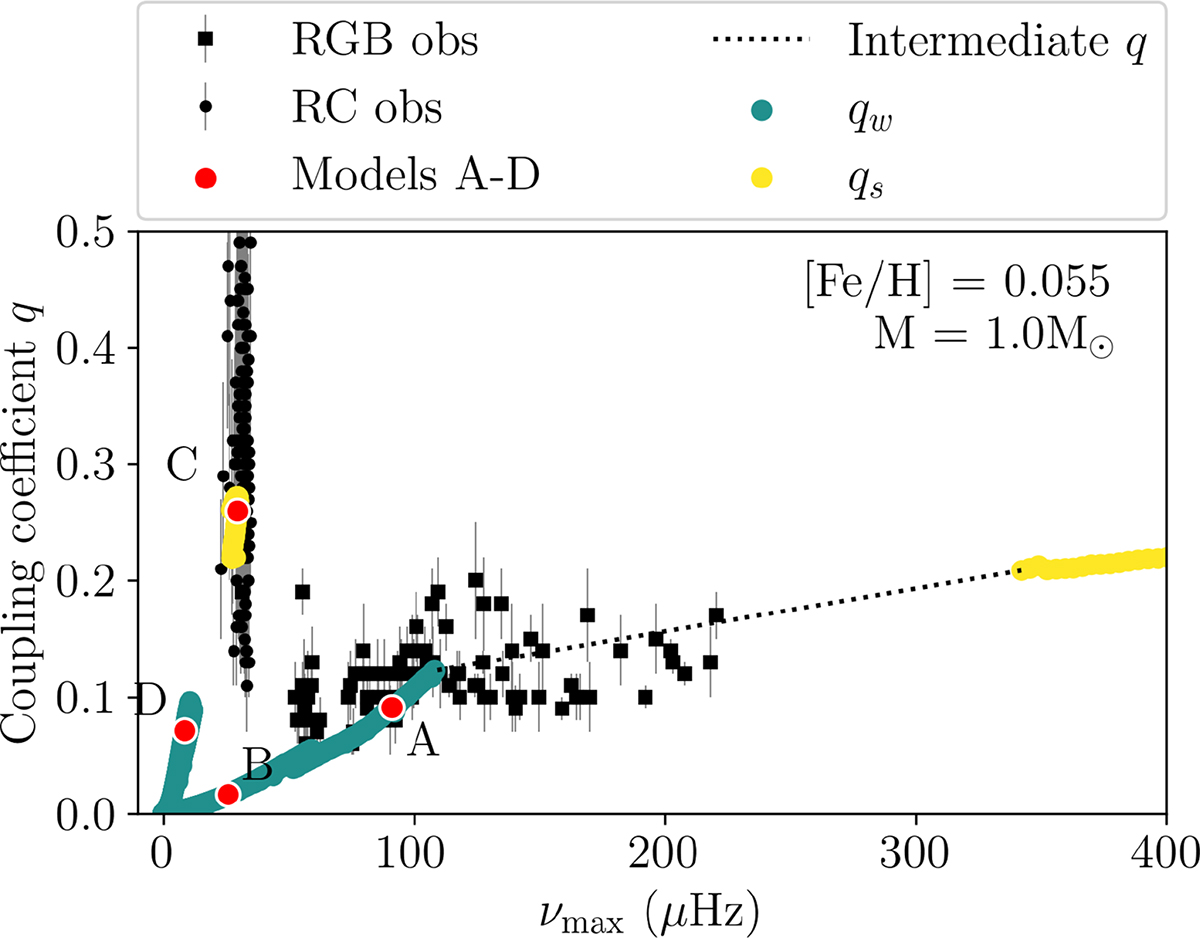
Fig. 9.
Download original image
Track of a 1 M⊙ star with solar metallicity showing the coupling coefficient q as a function of νmax. Yellow points indicate strong coupling, cyan points indicate weak coupling. Observed coupling and Δν (Vrard et al. 2016; Mosser et al. 2017) in stars with masses between 0.9 M⊙ and 1.1 M⊙ and metallicities between −0.070 and 0.180 are shown as black dots and squares, with dots having ΔΠ1 ≤ 130 s and squares ΔΠ1 > 130 s. The red points show the locations of models A–D.
Current usage metrics show cumulative count of Article Views (full-text article views including HTML views, PDF and ePub downloads, according to the available data) and Abstracts Views on Vision4Press platform.
Data correspond to usage on the plateform after 2015. The current usage metrics is available 48-96 hours after online publication and is updated daily on week days.
Initial download of the metrics may take a while.