Fig. 7.
Download original image
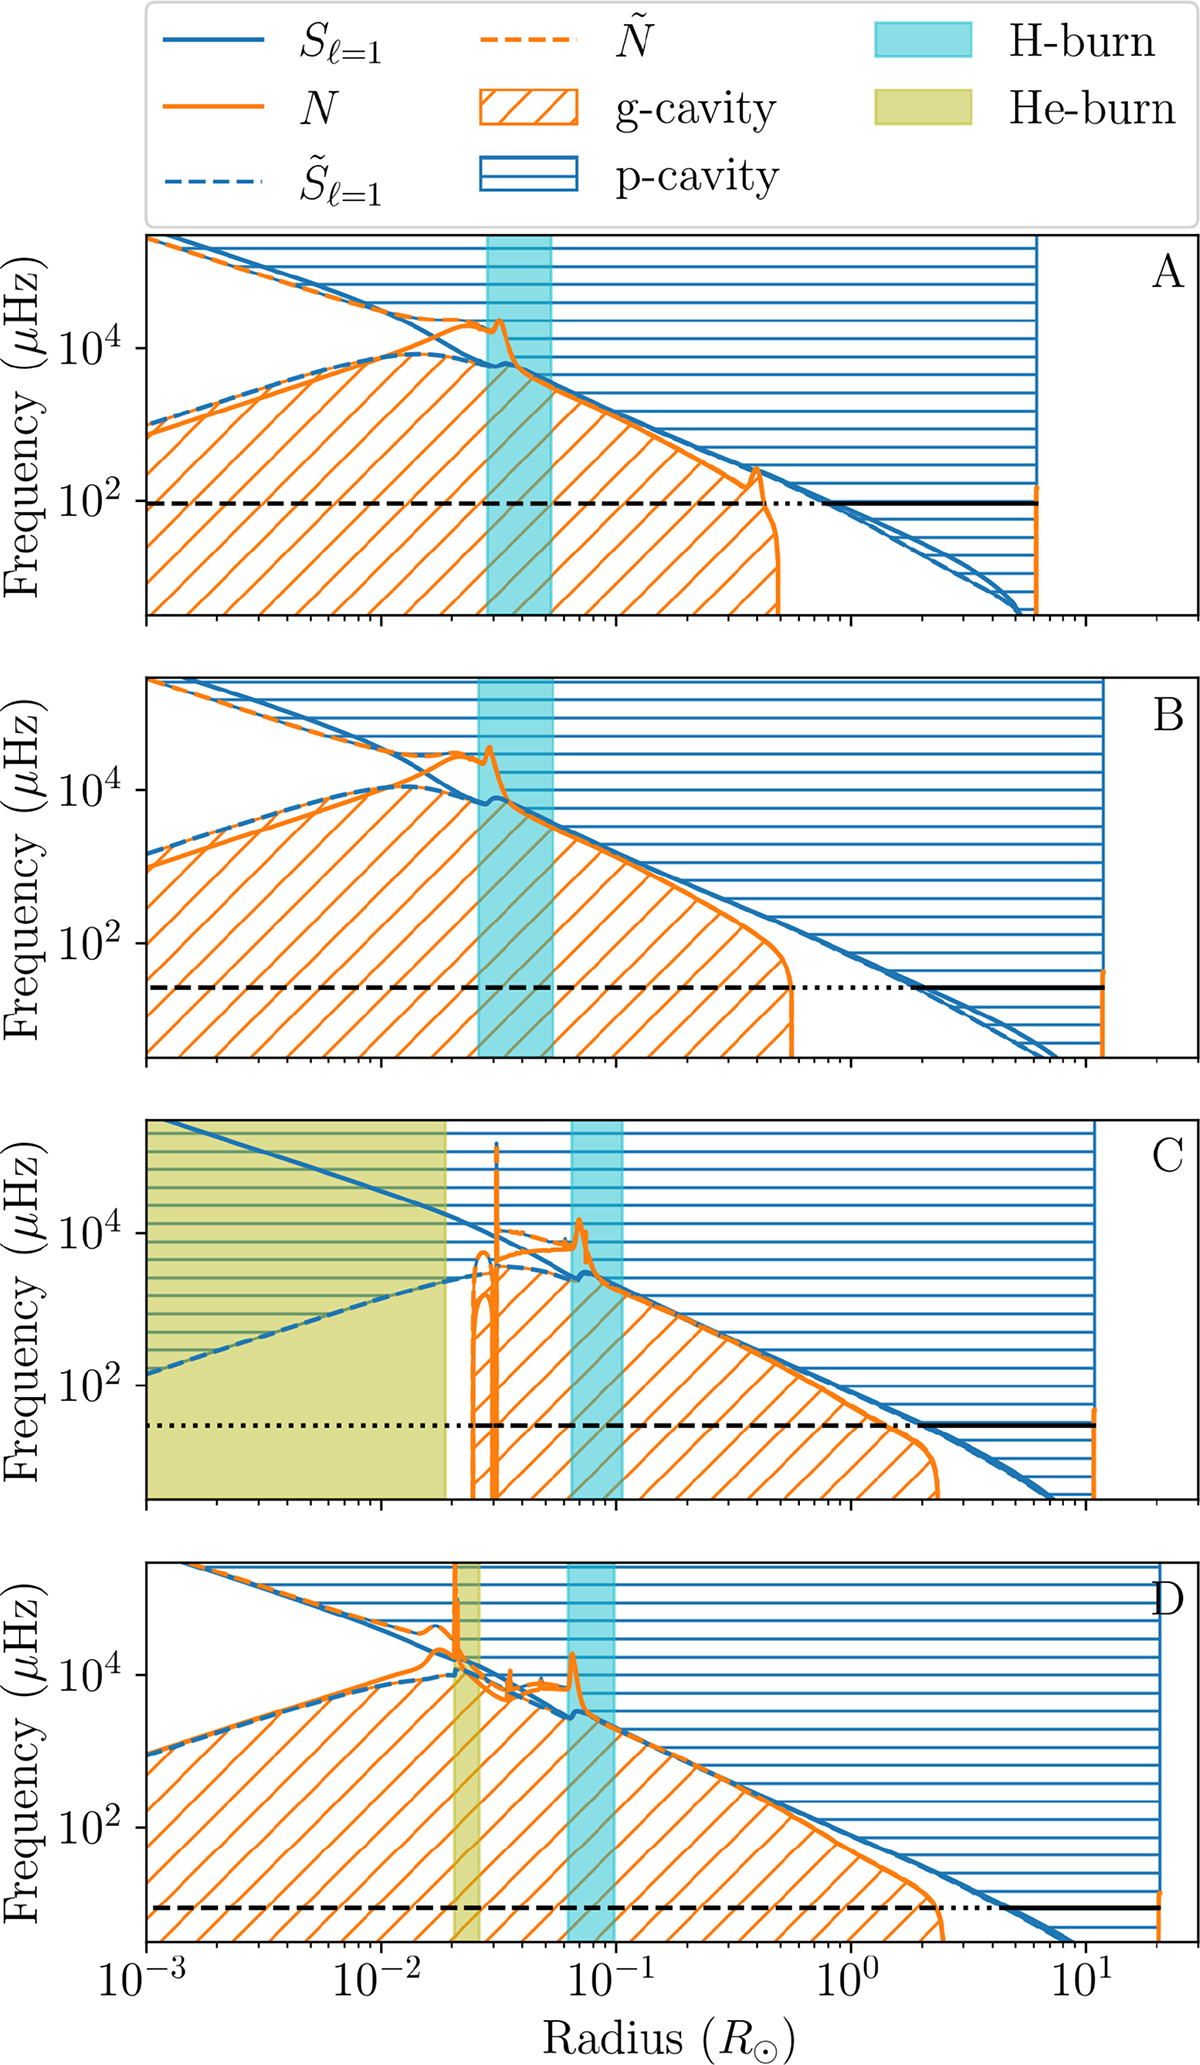
Propagation diagrams of models A–D. The Lamb (S) and reduced Lamb ![]() frequencies are shown as blue and green lines, the Brunt-Väisälä (N) and reduced Brunt-Väisälä
frequencies are shown as blue and green lines, the Brunt-Väisälä (N) and reduced Brunt-Väisälä ![]() frequencies are shown as orange and red lines. νmax is shown as a black line where the dashed part is inside the g-cavity, dotted part in the EZ, and solid part in the p-cavity.
frequencies are shown as orange and red lines. νmax is shown as a black line where the dashed part is inside the g-cavity, dotted part in the EZ, and solid part in the p-cavity.
Current usage metrics show cumulative count of Article Views (full-text article views including HTML views, PDF and ePub downloads, according to the available data) and Abstracts Views on Vision4Press platform.
Data correspond to usage on the plateform after 2015. The current usage metrics is available 48-96 hours after online publication and is updated daily on week days.
Initial download of the metrics may take a while.