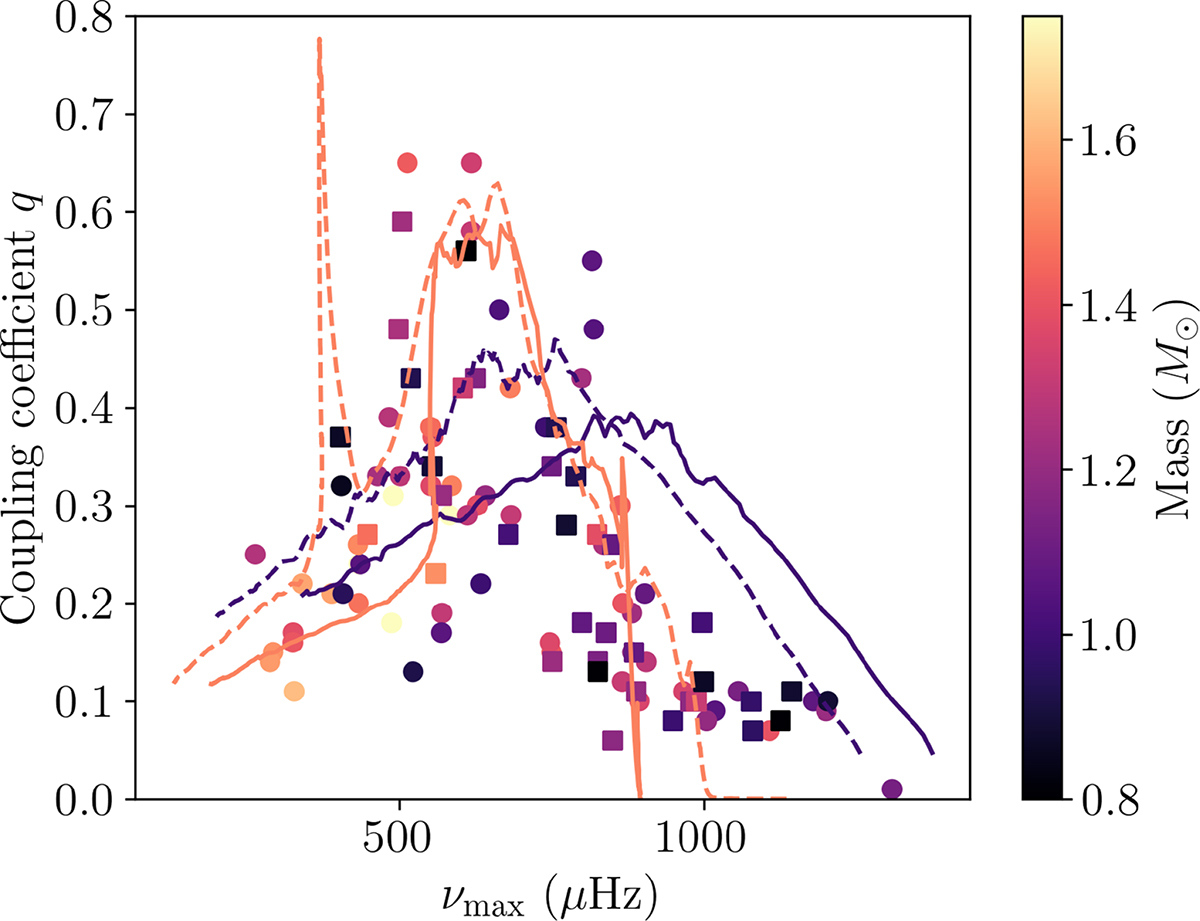
Fig. 4.
Download original image
Mixed mode coupling q of SGB stars as a function of νmax. Observed couplings from Appourchaux (2020) are shown as squares, and from Mosser (2024, priv. comm.) are shown as circles. Mass is calculated using the asteroseismic scaling relations (Kjeldsen & Bedding 1995), and is indicated using colour. Model tracks with masses 1 M⊙ and 1.5 M⊙ with [Fe/H] = −0.5 are shown as dashed lines, and with [Fe/H] = 0.0 as solid lines. Stars evolve from right to left.
Current usage metrics show cumulative count of Article Views (full-text article views including HTML views, PDF and ePub downloads, according to the available data) and Abstracts Views on Vision4Press platform.
Data correspond to usage on the plateform after 2015. The current usage metrics is available 48-96 hours after online publication and is updated daily on week days.
Initial download of the metrics may take a while.