Fig. C.1.
Download original image
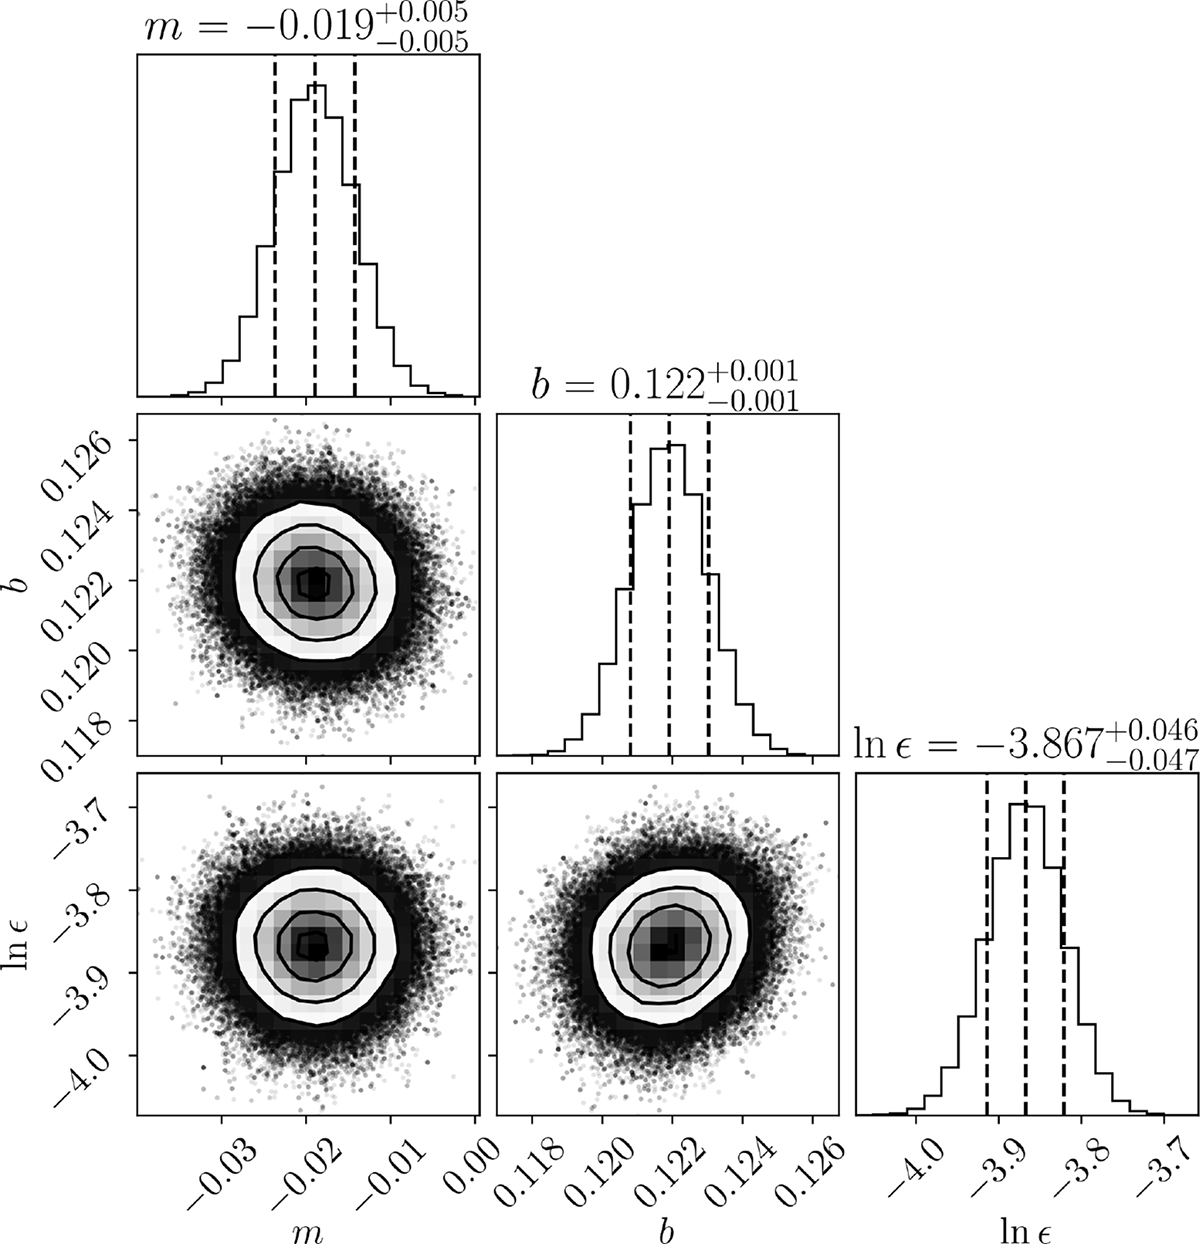
Corner plot of the slope m, y-intercept b, and intrinsic scatter ϵ posterior distributions from the RGB fit. The marginalized posterior distributions are shown in the panels in the diagonal with the 16th, 50th, and 84th percentiles shown as vertical dashed lines. The other panels show the 2-d histogram of the joint posterior distributions.
Current usage metrics show cumulative count of Article Views (full-text article views including HTML views, PDF and ePub downloads, according to the available data) and Abstracts Views on Vision4Press platform.
Data correspond to usage on the plateform after 2015. The current usage metrics is available 48-96 hours after online publication and is updated daily on week days.
Initial download of the metrics may take a while.