Open Access
Fig. A.4.
Download original image
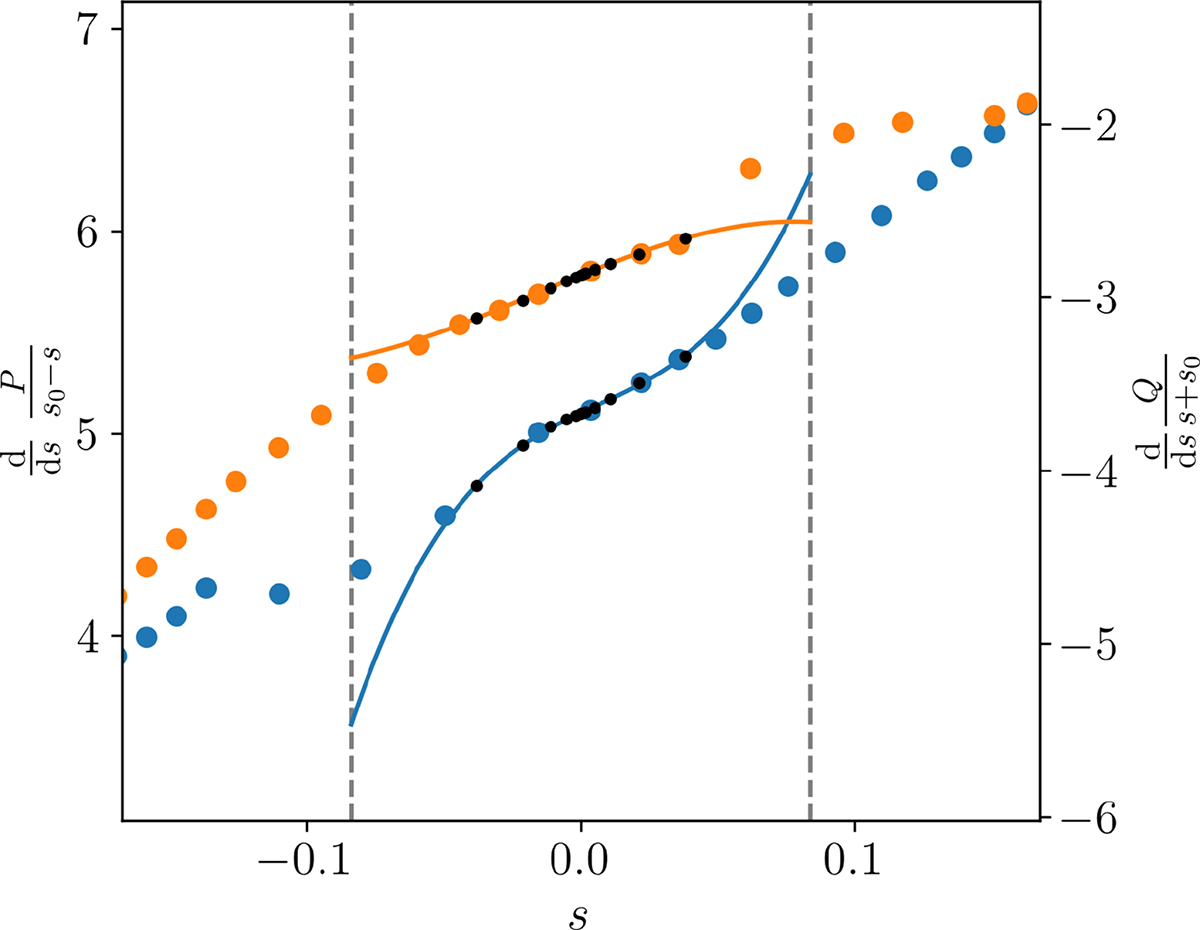
![]() is shown in blue, and
is shown in blue, and ![]() is shown in orange. Large coloured dots are the calculated gradient after inserting the point using de l’Hôpital’s rule. The small black dots are the remeshed points, and the solid lines show the fitted cubic. The vertical grey dashed lines show ±s0.
is shown in orange. Large coloured dots are the calculated gradient after inserting the point using de l’Hôpital’s rule. The small black dots are the remeshed points, and the solid lines show the fitted cubic. The vertical grey dashed lines show ±s0.
Current usage metrics show cumulative count of Article Views (full-text article views including HTML views, PDF and ePub downloads, according to the available data) and Abstracts Views on Vision4Press platform.
Data correspond to usage on the plateform after 2015. The current usage metrics is available 48-96 hours after online publication and is updated daily on week days.
Initial download of the metrics may take a while.